
Introduction
In this tutorial, we will see the implementation of Agglomerative Hierarchical Clustering in Python Sklearn and Scipy. First of all, we will understand in brief what is hierarchical clustering and how agglomerative clustering works. Then we will create our own sample dataset to show an example of creating a dendrogram graph in Scipy and implementing agglomerative clustering in sklearn.
What is Hierarchical Clustering?
Hierarchical clustering is an unsupervised clustering algorithm used to create clusters with a tree-like hierarchy. In this clustering method, there is no need to give the number of clusters to the algorithm. In contrast to this, the other algorithm like K-Mean produces flat clusters where there is no hierarchy and we also have to choose the number of clusters, to begin with.
What is Dendrogram in Hierarchical Clustering?
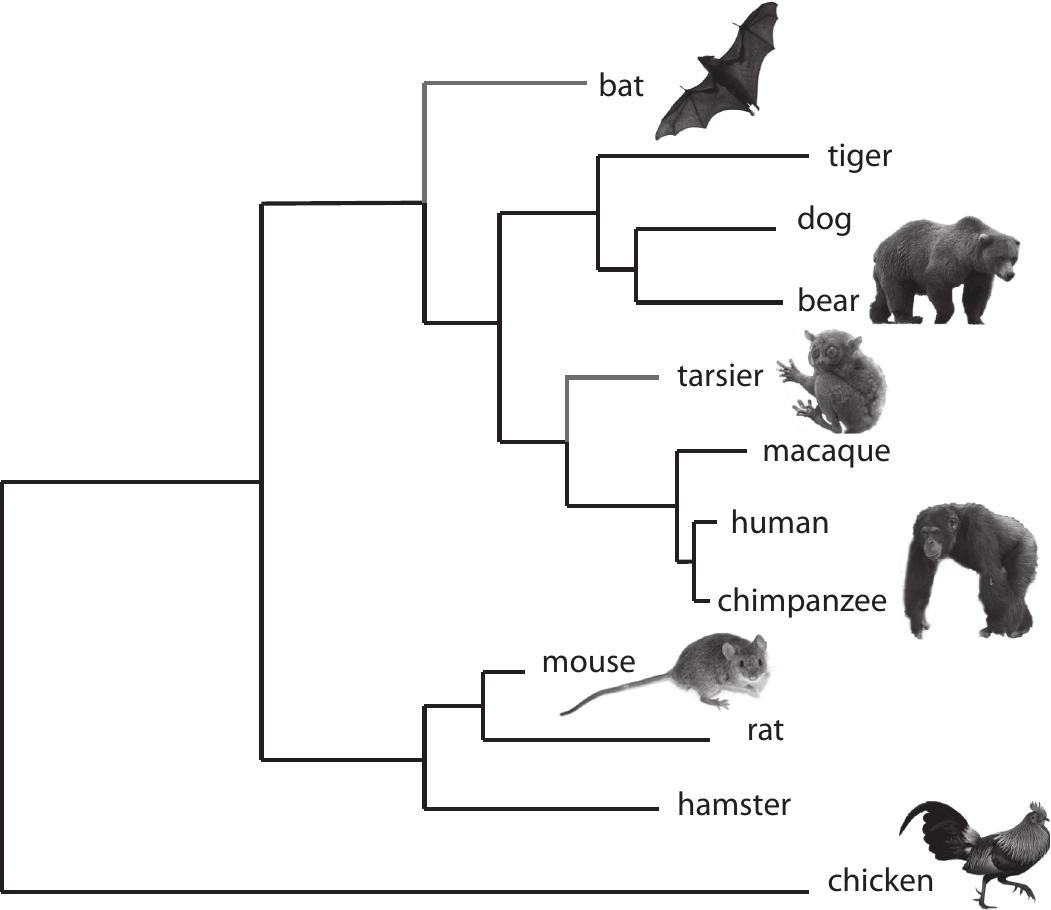
The hierarchical clustering creates a tree-like graph structure called Dendrogram that displays the sequences of merges/splits denoting the hierarchical relationship between the clusters.
A very good real-world example of a dendrogram is the representation of animal kingdom taxonomy as shown in the below diagram.
Types of Hierarchical Clustering
The hierarchical clustering algorithm can be of two types –
- Divisive Clustering – It takes a top-down approach where the entire data observation is considered to be one big cluster at the start. Then subsequently it is split into two clusters, then three clusters, and so on until each data ends up as a separate cluster.
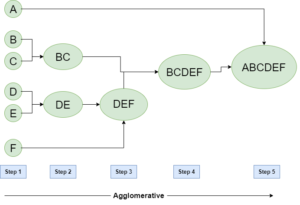
- Agglomerative Clustering – It takes a bottom-up approach where it assumes individual data observation to be one cluster at the start. Then it starts merging the data points into clusters till it creates one final cluster at the end with all data points.
Ideally, both divisive and agglomeration hierarchical clustering produces the same results. However, agglomeration clustering is computationally fast and hence we are going to cover this further in the article.
Agglomerative Clustering
As we discussed earlier, agglomerative clustering follows a bottom-up approach and starts by placing each data point in its own cluster. It then merges each of these individual clusters into larger and larger clusters, up until all of the data points are grouped into a single cluster, also called root, or until certain termination conditions are satisfied.
This produces a tree-based representation of the data points called Dendrogram that we discussed above.
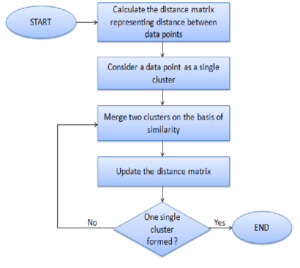
Algorithm for Agglomerative Clustering
1) Each data point is assigned as a single cluster
2) Determine the distance measurement and calculate the distance matrix
3) Determine the linkage criteria to merge the clusters
4) Update the distance matrix
5) Repeat the process until every data point becomes one cluster
Parameters of Agglomerative Clustering
The agglomeration hierarchical clustering can have multiple variations depending on affinity and linkage. Let us understand this in more detail.
Affinity
Affinity denotes the method using which the distance or similarity between data points or clusters is calculated. The common ones are –
- Euclidean
- Manhattan
- Cosine
Linkage
The clusters are formed by using different types of criteria or knowns as linkage functions. Linkage methods use the affinity that we discussed above.
The different linkage methods produce different results of hierarchical clustering, they are listed below –
- Single
- Complete
- Average
- Wards
Agglomerative Clustering with No. of Clusters as Input
Fundamentally speaking agglomerative clustering does not require the input of the number of clusters. However, it is possible to give the number of clusters as input using agglomerative clustering to produce flat clusters like that of K-means. Although here there is no definite rule on how to determine the number of clusters, there is a good trick to arrive at an estimate of what will be the good number of clusters by using the dendrogram graph. We shall see this in the practical example below.
Agglomerative Hierarchical Clustering with Scipy & Sklearn
Let us now see how we can implement agglomerative hierarchical clustering by using Scipy and Sklearn packages of Python. For this purpose, we are going to create our own sample toy data set for better visualization and understanding.
Import Libraries
To start with, let us import the required libraries shown below.
In [0]:
import pandas as pd
from sklearn.datasets import make_moons
import matplotlib.pyplot as plt
from scipy.cluster.hierarchy import dendrogram, linkage
from sklearn.cluster import AgglomerativeClustering
from sklearn.datasets import make_blobs
The Dataset
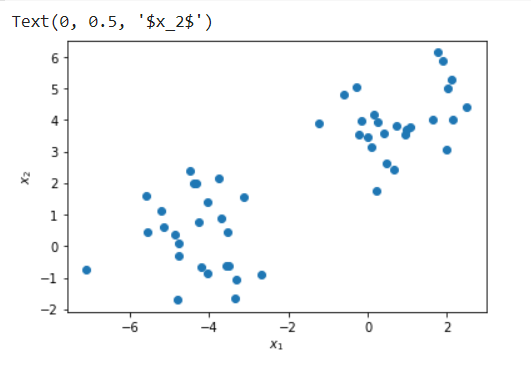
Here we use make_blobs module of sklearn.datasets package of Scikit Learn to create a custom toy dataset of 50 data points with two features.
In [1]:
X, y = make_blobs(n_samples=50, centers=2, n_features=2,random_state=3)
df=pd.DataFrame(X,y)
df=df.rename(columns={0: "X1", 1:"X2"})
df.head()
Out[1]:
| X1 | X2 | |
|---|---|---|
| 1 | -3.336072 | -1.644337 |
| 0 | 0.092166 | 3.139081 |
| 1 | -5.552574 | 0.455115 |
| 0 | -0.297907 | 5.047579 |
| 0 | 0.419308 | 3.574362 |
In [2]:
plt.scatter(X[:, 0], X[:, 1], label=y)
plt.xlabel("$x_1$")
plt.ylabel("$x_2$")
Out[2]:
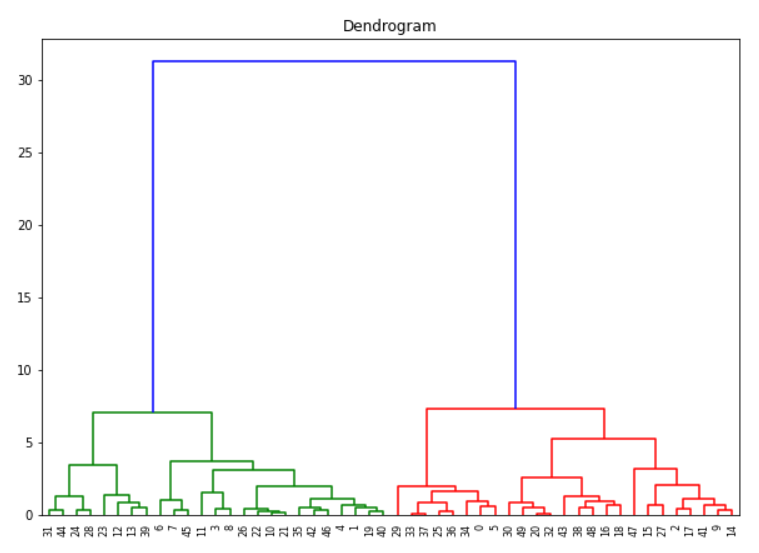
Creating Dendrogram with Python Scipy
Python Scipy has dendrogram and linkage module inside scipy.cluster.hierarchy package that can be used for creating the dendrogram graph of agglomerative clustering.
Here we first create the linkage object with method = ward and affinity metric as euclidean and then use this to create the dendrogram.
In [3]:
#Dendrogram plot
plt.figure(figsize =(10,7))
plt.title('Dendrogram')

linkage_method = linkage(df, method ='ward', metric='euclidean')
Dendrogram = dendrogram(linkage_method)
Out[3]:
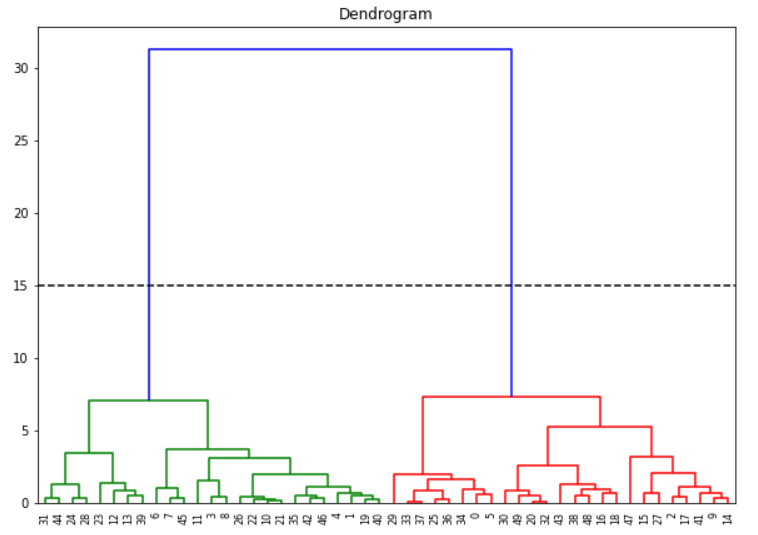
Determining No. of Clusters with Dendrogram
If you want to create flat clusters we can analyze the above dendrogram to determine no. of clusters. We first assume that the horizontal lines are extended on both sides, and as such, they would also cross the vertical lines. Now we have to identify the tallest vertical line that does not have any horizontal line crossing through it.
In the above dendrogram graph, such a vertical line is the blue line. We now draw a horizontal line across this vertical line as shown below. This horizontal line cuts the vertical line at two places, and this means the optimal number of clusters is 2.
Another way is to visually see which vertical line is showing the biggest jump. Since the vertical line denotes the distance or similarity between the two clusters, the big jump signifies the two clusters are not very similar. Again draw the horizontal line through this vertical line and the number of cuts it makes is optimal no. of clusters. Again in our example, it is the blue line, and the horizontal line cuts at two places so no. of clusters is 2.
(It should be noted however that these methods do not always guarantee the optimal number of clusters, it is just a guideline)
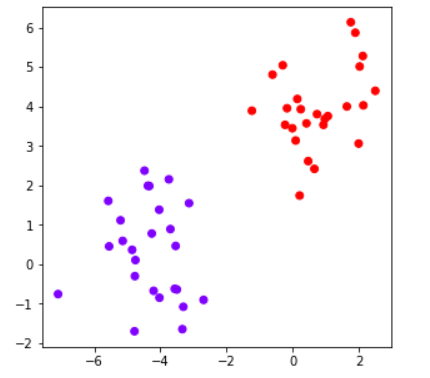
Agglomerative Clustering with Sklearn
We now use AgglomerativeClustering module of sklearn.cluster package to create flat clusters by passing no. of clusters as 2 (determined in the above section). Again we use euclidean and ward as the parameters.
This results in two clusters and visually we can say that the results are good and as expected.
In[4]:
cluster_ea = AgglomerativeClustering(n_clusters=2, linkage='ward',affinity='euclidean')

# Visualizing the clustering
plt.figure(figsize =(5, 5))
plt.scatter(df['X1'], df['X2'], c = cluster_ea.fit_predict(df),cmap='rainbow')
plt.show()
Out[4]:
- Also Read – Tutorial for DBSCAN Clustering in Python Sklearn
- Also Read – Tutorial for K Means Clustering in Python Sklearn

