
Introduction:
In this tutorial, we will learn how to apply the K-means clustering in Sklearn library. We will first have a brief overview of what is meant by clustering, followed by understanding what the K-means algorithm is. Then, we will go through the working principle of the K-means algorithm, after which we shall implement and end to end code in which we shall implement this algorithm to perform customer segmentation using the ‘Mall_Customers.csv’ dataset. We will then look at the two methods namely the Elbow and Silhouette methods, by which we can calculate the optimum number of clusters within a given dataset.
What is Clustering?
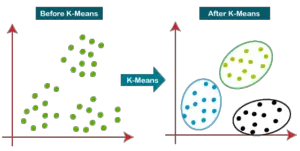
Clustering is the task of segmenting a set of data into distinct groups such that the data points in the same group will bear similar characteristics as opposed to those data points which lie in the groups/clusters. Our main objective here is to segregate groups having similar characteristics assign them unique clusters.
- The points present in the same cluster should have similar properties
- The points present in the different clusters should be as dissimilar as possible
What is K-Means Algorithm?
K-Means Clustering comes under the category of Unsupervised Machine Learning algorithms, these algorithms group an unlabeled dataset into distinct clusters. The K defines the number of pre-defined clusters that need to be created, for instance, if K=2, there will be 2 clusters, similarly for K=3, there will be three clusters. The primary goal while implementing k-means involves defining k clusters such that total within-cluster variation (or error) is minimum.
The cluster center is the arithmetic mean of all the data points that belong to that cluster. The squared distance between every given point and its cluster center is called variation. The goal of the k-means clustering is to ascertain these k clusters and their centers whilst reducing the total error.
How does the K-Means Algorithm Work?
The steps of the underlying working principle that govern the K-Means Algorithm have been enlisted below:
Step-1:To decide the number of clusters, we select an appropriate value of K.
Step-2: Now choose random K points/centroids.
Step-3: Each data point will be assigned to its nearest centroid and this will form a predefined cluster.
Step-4: Now we shall calculate variance and position a new centroid for every cluster.
Step-5: The 3rd step will be repeated, meaning, every data point will be assigned to the new nearest centroid.
Step-6: If a reassignment has occurred then step-4 shall be executed otherwise execution finishes.
Step-7: Finally, the model is ready
Example of K Means Clustering in Python Sklearn
We can easily implement K-Means clustering in Python with Sklearn KMeans() function of sklearn.cluster module. For this example, we will use the Mall Customer dataset to segment the customers in clusters based on their Age, Annual Income, Spending Score, etc.
Import Libraries
Let us import the important libraries that will be required by us.
from sklearn.cluster import KMeans
from sklearn import preprocessing
import sklearn.cluster as cluster
import sklearn.metrics as metrics
import pandas as pd
from sklearn.preprocessing import MinMaxScaler
import seaborn as sns
from matplotlib import pyplot as plt
%matplotlib inline
Load Dataset
Let us load the dataset into a dataframe and take a look at some of its rows. Also with the shape function, it can be seen that it has 4 columns and 200 rows.
df = pd.read_csv(r"Mall_Customers.csv")
df.head()
| Gender | Age | Annual Income (k$) | Spending Score (1-100) | |
|---|---|---|---|---|
| 0 | Male | 19 | 15 | 39 |
| 1 | Male | 21 | 15 | 81 |
| 2 | Female | 20 | 16 | 6 |
| 3 | Female | 23 | 16 | 77 |
| 4 | Female | 31 | 17 | 40 |
df.shape
(200, 4)
Objective
Customer segmentation deals with grouping clusters together based on some common patterns within their attributes. To keep the example simple and to visualize the clustering on a 2-D graph we will use only two attributes Annual Income and Spending Score. Don’t worry we will also show you after this how you can use more than 2 attributes for clustering and still visualize the results in 2-D with the help of Principal Component Analysis (PCA).
Apply Feature Scaling
Clustering algorithms like K-means require feature scaling of the data as part of data preprocessing to produce good results. This is because clustering techniques use distance calculation between the data points. Hence it is proper to bring data of different units under a common scale.
- For more details, you may read following article –
Sklearn Feature Scaling with StandardScaler, MinMaxScaler, RobustScaler and MaxAbsScaler
We have used MinMaxScaler for our example as shown below. In the new dataframe df_scale it can been seen that both attributes Annual Income and Spending Score are normalized.
scaler = MinMaxScaler()
scale = scaler.fit_transform(df[['Annual Income (k$)','Spending Score (1-100)']])
df_scale = pd.DataFrame(scale, columns = ['Annual Income (k$)','Spending Score (1-100)']);
df_scale.head(5)
| Annual Income (k$) | Spending Score (1-100) | |
|---|---|---|
| 0 | 0.000000 | 0.387755 |
| 1 | 0.000000 | 0.816327 |
| 2 | 0.008197 | 0.051020 |
| 3 | 0.008197 | 0.775510 |
| 4 | 0.016393 | 0.397959 |
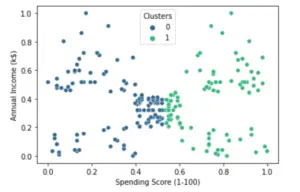
Applying Kmeans with 2 Clusters (K=2)
km=KMeans(n_clusters=2)
y_predicted = km.fit_predict(df[['Annual Income (k$)','Spending Score (1-100)']])
y_predicted
array([0, 1, 0, 1, 0, 1, 0, 1, 0, 1, 0, 1, 0, 1, 0, 1, 0, 1, 0, 1, 0, 1,
       0, 1, 0, 1, 0, 1, 0, 1, 0, 1, 0, 1, 0, 1, 0, 1, 0, 1, 0, 1, 0, 1,
       0, 1, 1, 0, 0, 0, 0, 1, 1, 1, 0, 0, 0, 0, 0, 0, 1, 1, 0, 1, 0, 1,
       0, 0, 1, 0, 1, 0, 0, 1, 0, 1, 1, 0, 0, 0, 0, 1, 0, 0, 1, 0, 1, 1,
       1, 0, 1, 0, 0, 0, 0, 0, 0, 0, 0, 0, 0, 0, 1, 1, 1, 0, 0, 0, 0, 0,
       0, 1, 0, 0, 0, 0, 0, 1, 0, 1, 1, 0, 1, 1, 0, 1, 0, 1, 0, 1, 0, 1,
       0, 1, 0, 1, 0, 1, 0, 1, 0, 1, 0, 1, 0, 1, 0, 1, 0, 1, 0, 1, 0, 1,
       0, 1, 0, 1, 0, 1, 0, 1, 0, 1, 0, 1, 0, 1, 0, 1, 0, 1, 0, 1, 0, 1,
       0, 1, 0, 1, 0, 1, 0, 1, 0, 1, 0, 1, 0, 1, 0, 1, 0, 1, 0, 1, 0, 1,
       0, 1])
km.cluster_centers_
array([[0.36929553, 0.31163817],
       [0.37861485, 0.73950929]])
df['Clusters'] = km.labels_
sns.scatterplot(x="Spending Score (1-100)", y="Annual Income (k$)",hue = 'Clusters',  data=df,palette='viridis')
<AxesSubplot:xlabel='Spending Score (1-100)', ylabel='Annual Income (k$)'>
Finding Optimum number of Clusters in K Means
i) Elbow Method with Within-Cluster-Sum of Squared Error (WCSS)
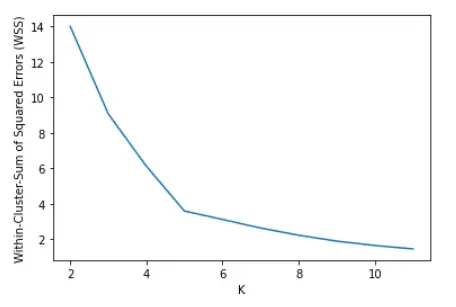
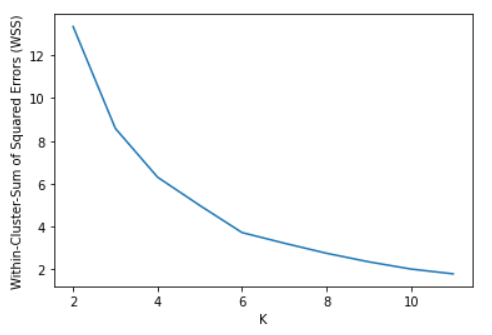
The Elbow Method is a popular technique for determining the optimal number of clusters. Here, we calculate the Within-Cluster-Sum of Squared Errors (WCSS) for various values of k and choose the k for which WSS first starts to diminish. In the plot of WSS-versus-k, this can be observed as an elbow.
- The Squared Error for a data point is the square of the distance of a point from its cluster center.
- The WSS score is the summation of Squared Errors for all given data points.
- Distance metrics like Euclidean Distance or the Manhattan Distance can be used.
Continuing with our example, we calculate the WCSS for K=2 to k=12 and calculate the WCSS in each iteration.
In [8]:
K=range(2,12)
wss = []

for k in K:
    kmeans=cluster.KMeans(n_clusters=k)
    kmeans=kmeans.fit(df_scale)
    wss_iter = kmeans.inertia_
    wss.append(wss_iter)
Let us now plot the WCSS vs K cluster graph. It can be seen below that there is an elbow bend at K=5 i.e. it is the point after which WCSS does not diminish much with the increase in value of K.
plt.xlabel('K')
plt.ylabel('Within-Cluster-Sum of Squared Errors (WSS)')
plt.plot(K,wss)
ii) The Silhouette Method
The silhouette value measures the similarity of a data point within its cluster. It has a range between +1 and -1 and the higher values denote a good clustering.
Below we calculate the Silhouette Score for k=2 to 12 and it can be seen that the maximum value is for k=5. This is in line with the elbow method.
In [10]:
import sklearn.cluster as cluster
import sklearn.metrics as metrics
for i in range(2,13):
labels=cluster.KMeans(n_clusters=i,random_state=200).fit(df_scale).labels_
print ("Silhouette score for k(clusters) = "+str(i)+" is "
+str(metrics.silhouette_score(df_scale,labels,metric="euclidean",sample_size=1000,random_state=200)))
Silhouette score for k(clusters) = 2 is 0.33340205479521
Silhouette score for k(clusters) = 3 is 0.4514909309424474
Silhouette score for k(clusters) = 4 is 0.49620078745146784
Silhouette score for k(clusters) = 5 is 0.5594854531227246
Silhouette score for k(clusters) = 6 is 0.5380652777999084
Silhouette score for k(clusters) = 7 is 0.43787929453711455
Silhouette score for k(clusters) = 8 is 0.43074523601514214
Silhouette score for k(clusters) = 9 is 0.4421331695270676
Silhouette score for k(clusters) = 10 is 0.44563877983976935
Silhouette score for k(clusters) = 11 is 0.44293254541345917
Silhouette score for k(clusters) = 12 is 0.4427512711673661
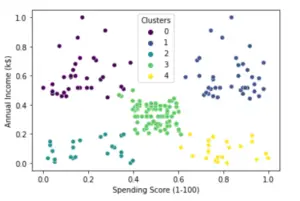
Applying Kmeans with 5 Clusters (K=5)
# We will use 2 Variables for this example
kmeans = cluster.KMeans(n_clusters=5 ,init="k-means++")
kmeans = kmeans.fit(df[['Annual Income (k$)','Spending Score (1-100)']])
Finally, let us plot the graph with k=5 clusters and we can see that now the K-Means result looks good.
df['Clusters'] = kmeans.labels_

sns.scatterplot(x="Spending Score (1-100)", y="Annual Income (k$)",hue = 'Clusters',  data=df,palette='viridis')
K Means Clustering in Python Sklearn with Principal Component Analysis
In the above example, we used only two attributes to perform clustering because it is easier for us to visualize the results in 2-D graph. We cannot visualize anything beyond 3 attributes in 3-D and in real-world scenarios there can be hundred of attributes. So how can we visualize the clustering results?
Well, it can be done by applying principal component analysis (PCA) on the dataset to reduce its dimension to only two while still preserving the information. And then clustering can be applied to this transformed dataset and then visualized in a 2-D plot. Moreover, PCA can also help to avoid the curse of dimensionality.
- For more details on PCA, you can read the following article –
Complete Tutorial of PCA in Python Sklearn with Example
So let us see this practically below where we will use 3 attributes on the same dataset.
Load Dataset
Let us again load the dataset in the dataframe like before.
df = pd.read_csv(r"Mall_Customers.csv")
df.head()
| Gender | Age | Annual Income (k$) | Spending Score (1-100) | |
|---|---|---|---|---|
| 0 | Male | 19 | 15 | 39 |
| 1 | Male | 21 | 15 | 81 |
| 2 | Female | 20 | 16 | 6 |
| 3 | Female | 23 | 16 | 77 |
| 4 | Female | 31 | 17 | 40 |
Apply Feature Scaling
This time we are applying feature scaling on our desired columns Age, Annual Income and Spending Score.
scaler = MinMaxScaler()

scale = scaler.fit_transform(df[['Age','Annual Income (k$)','Spending Score (1-100)']])

df_scale = pd.DataFrame(scale, columns = ['Age','Annual Income (k$)','Spending Score (1-100)']);
df_scale.head(5)
Out[14]:
| Age | Annual Income (k$) | Spending Score (1-100) | |
|---|---|---|---|
| 0 | 0.019231 | 0.000000 | 0.387755 |
| 1 | 0.057692 | 0.000000 | 0.816327 |
| 2 | 0.038462 | 0.008197 | 0.051020 |
| 3 | 0.096154 | 0.008197 | 0.775510 |
| 4 | 0.250000 | 0.016393 | 0.397959 |
Applying PCA
Now let us reduce the dimensionality of the dataset into two components.
In [15]:
from sklearn.decomposition import PCA
pca = PCA(n_components=2)
principalComponents = pca.fit_transform(df_scale)
pca_df = pd.DataFrame(data = principalComponents
             , columns = ['principal component 1', 'principal component 2'])
pca_df.head()
| principal component 1 | principal component 2 | |
|---|---|---|
| 0 | -0.192221 | 0.319683 |
| 1 | -0.458175 | -0.018152 |
| 2 | 0.052562 | 0.551854 |
| 3 | -0.402357 | -0.014239 |
| 4 | -0.031648 | 0.155578 |
Finding Optimum Value of K
i) Elbow Method with Within-Cluster-Sum of Squared Error (WCSS)
K=range(2,12)
wss = []
for k in K:
    kmeans=cluster.KMeans(n_clusters=k)
    kmeans=kmeans.fit(pca_df)
    wss_iter = kmeans.inertia_
    wss.append(wss_iter)
plt.xlabel('K')
plt.ylabel('Within-Cluster-Sum of Squared Errors (WSS)')
plt.plot(K,wss)
ii) The Silhouette Method
Using the Silhouette method, it can be seen that the Silhouette value is maximum for K=5. Hence it can be concluded that the dataset can be segmented properly with 6 clusters.
In[18]:
import sklearn.cluster as cluster
import sklearn.metrics as metrics
for i in range(2,12):
    labels=cluster.KMeans(n_clusters=i,random_state=200).fit(pca_df).labels_
    print ("Silhouette score for k(clusters) = "+str(i)+" is "
           +str(metrics.silhouette_score(pca_df,labels,metric="euclidean",sample_size=1000,random_state=200)))
Silhouette score for k(clusters) = 2 is 0.4736269407502857
Silhouette score for k(clusters) = 3 is 0.44839082753844756
Silhouette score for k(clusters) = 4 is 0.43785291876777566
Silhouette score for k(clusters) = 5 is 0.45130680489606634
Silhouette score for k(clusters) = 6 is 0.4507847568968469
Silhouette score for k(clusters) = 7 is 0.4458795480456887
Silhouette score for k(clusters) = 8 is 0.4132957148795121
Silhouette score for k(clusters) = 9 is 0.4170428610065107
Silhouette score for k(clusters) = 10 is 0.4309783655094101
Silhouette score for k(clusters) = 11 is 0.42535265774570674
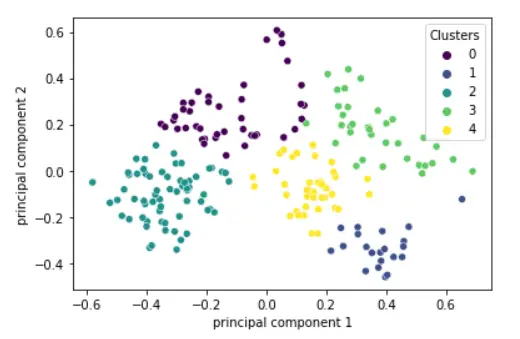
Applying Kmeans with 5 Clusters (K=5)
K Mean clustering is applied with SKlearn KMeans() by passing the value of k=5
In [19]:
kmeans = cluster.KMeans(n_clusters=5)
kmeans = kmeans.fit(pca_df)
pca_df['Clusters'] = kmeans.labels_

sns.scatterplot(x="principal component 1", y="principal component 2",hue = 'Clusters',  data=pca_df,palette='viridis')
Out[20]:
Conclusion
We hope you liked our tutorial and now better understand how to implement K-means clustering using Sklearn(Scikit Learn) in Python. Here, we have illustrated an end-to-end example of using a dataset to build a K-means clustering model to achieve customer segmentation using(KMeans Clustering in Python.
References:
- https://scikit-learn.org/stable/modules/generated/sklearn.cluster.KMeans.html
- https://realpython.com/k-means-clustering-python/
- https://www.kaggle.com/khotijahs1/k-means-clustering-of-iris-dataset
- https://heartbeat.fritz.ai/k-means-clustering-using-sklearn-and-python-4a054d67b187https://heartbeat.fritz.ai/k-means-clustering-using-sklearn-and-python-4a054d67b187

