Introduction
Out of the box, the R language can be used to create good visualizations. In this post, we’ll go over how to make pie chart in R programming language by using pie() function. First, we’ll go through the syntax of the R pie() function, and then we’ll go over some examples of how to use this function to create pie charts.
Syntax of Pie Chart pie() function in R
The fundamental syntax of R’s pie() function, along with some main arguments, is shown below –
pie(x, labels, radius, main, col)
- x – It is a vector with datapoints for creating pie chart.
- labels – It is used to label the slices of pie chart.
- radius – It denotes the radius of the circle of the pie chart.
- main – Used for title of the chart.
- col – Denotes the color palette of pie chart.
Examples of Pie Chart in R Language
Data Creation
We will first create a sample data that will be used for all the examples of pie chart in R
We are feeding in custom values for mobile phone brands and their corresponding units sold(in thousands).0.3.
brand <-c('Xiaomi','Samsung','Vivo','Realme','Oppo','Others')
units <-c(27,18,21,8,12,23)
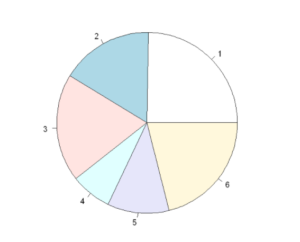
Example 1: Basic Pie chart in Base R Language
To create a basic pie chart we simply use the pie() function and pass the data to it as shown below.
pie(units)
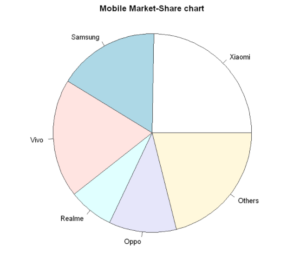
Example 2: Adding labels and titles to Pie chart in R
Let us see an illustration to understand how these methods work in creating an aesthetic pie chart with title and color.
pie(units,main="Mobile Market-Share chart" ,labels =brand, radius =1)
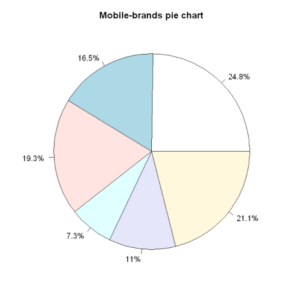
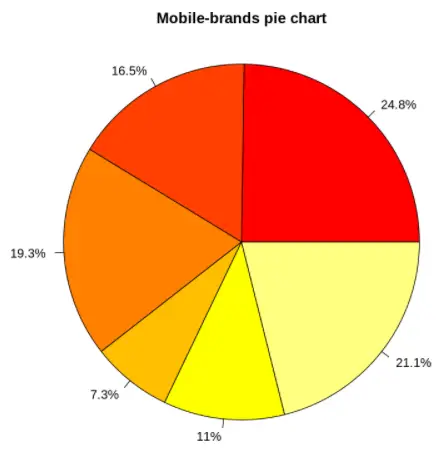
Example 3: Adding Slice percentage to Pie chart
Let us add slice percentage to our pie chart. For this purpose, we shall do a custom calculation of percentage using perc_value and use it with labels parameter of pie() function of R.
perc_value<- round(100 * units / sum(units), 1)

# Plot the chart
pie(units, labels = paste0(perc_value, "%"), radius=0.9,
    main = "Mobile-brands pie chart")
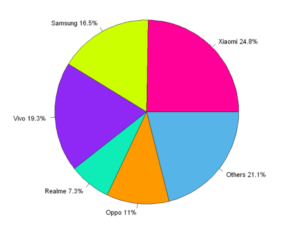
Example 4: Add custom color to Pie Chart
Now we will add custom colors to our piechart by using the col parameter. The color to each slice can be assigned explicitly as shown in the below example.
perc_value<- round(100 * units / sum(units), 1)

# Plot the chart
pie(units, labels = paste0(perc_value, "%"), radius=0.9,
main = "Mobile-brands pie chart",
col=c("#FF0099","#CCFF00","#8F28F5","#0EECB8","#FF9900","#56B4E9"))
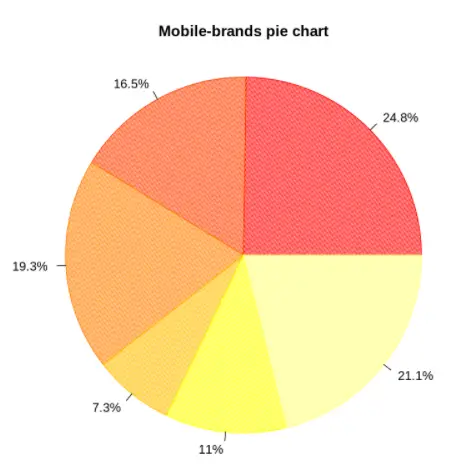
Example 5: Add Color Pallete to Pie Chart
perc_value<- round(100 * units / sum(units), 1)

# Plot the chart
pie(units, labels = paste0(perc_value, "%"), radius=1,
main = "Mobile-brands pie chart",
col=heat.colors(6))
Example 6: Hatch Fill Pie Chart
perc_value<- round(100 * units / sum(units), 1)

# Plot the chart
pie(units, labels = paste0(perc_value, "%"), radius=1,
    main = "Mobile-brands pie chart",
    col=heat.colors(6), density = 60, angle = 75)
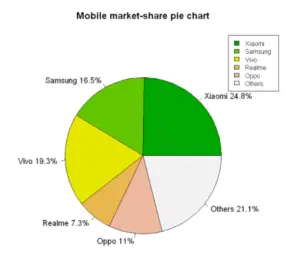
Example 7: Add a legend to Pie chart
We can add legends to plots in R by using the legend() function. Let us see how this is done in the following example.
perc_value<- round(100 * units / sum(units), 1)

pie(units, labels=paste0(brand," " ,perc_value, "%"), radius=0.7, main = "Mobile market-share pie chart", col = terrain.colors(6))

legend("topright", c('Xiaomi','Samsung','Vivo','Realme','Oppo','Others'), cex = 0.8, fill = terrain.colors(6))
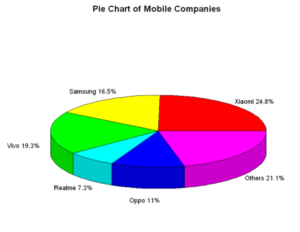
Example 8: 3-D Pie chart in R
if you want to create the 3D pie chart you can use the pie3D function from plotrix package of R. The default 3D pie chart will look like the following.
library(plotrix)

pie3D(units, labels=paste0(brand," " ,piepercent, "%"), main = "Pie Chart of Mobile Companies ")
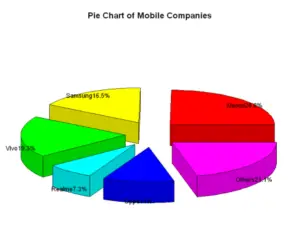
Example 9: Using Explode command in a 3-D Pie chart
We can also “explode” the pie with explode command, this will make the slices separate out.
pie3D(units, labels=paste0(brand,piepercent, "%"),,explode=0.25, main = "Pie Chart of Mobile Companies ")