Introduction
In this article, we will understand how to create Scatter Plot in Base R language. R is very popular for providing rich visualization options out of the box. Firs, we will understand the syntax of plot() and then see how to use it for creating scatterplots.
Syntax of Scatter Plot plot() function in R
The basic syntax for scatterplot plot() function is shown below with commonly used parameters. The detailed syntax can be found here.
plot(x, y, main, xlab, ylab, axes)
- x – Denotes the data to be used for the x-axis of the plot
- y – Denotes the data to be used for the x-axis of the plot
- main – Assigns a title to the scatter plot
- xlab – Assigns label to the x-axis of the scatter plot
- ylab – Assigns label to the y-axis of the scatter plot
- axes – Denotes if both axes should be drawn on the plot.
Examples of Scatter Plot in R Language
The Dataset
We are going to use the famous Iris dataset for all our examples of scatter plots in R. This dataset has 5 features – Sepal Length, Sepal Width, Petal Length, Petal Width, and Species. There are 3 distinct Species, that go by the name Iris-Setosa, Iris-Versicolor, and Iris-Virginica.
data("iris")
head(iris)
| Sepal.Length | Sepal.Width | Petal.Length | Petal.Width | Species |
|---|---|---|---|---|
| 5.1 | 3.5 | 1.4 | 0.2 | setosa |
| 4.9 | 3.0 | 1.4 | 0.2 | setosa |
| 4.7 | 3.2 | 1.3 | 0.2 | setosa |
| 4.6 | 3.1 | 1.5 | 0.2 | setosa |
| 5.0 | 3.6 | 1.4 | 0.2 | setosa |
| 5.4 | 3.9 | 1.7 | 0.4 | setosa |
We assign the features Sepal Length, Petal length, and Species into x, y, and z variables respectively to use these features conveniently in the below examples.
x <- iris$Sepal.Length
y <- iris$Petal.Length
z <- iris$Species
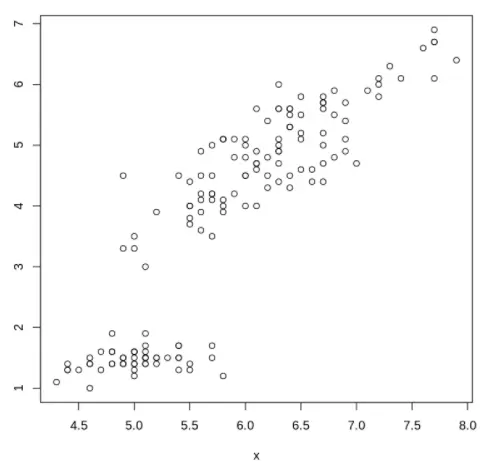
Example 1: Basic Scatterplot in Base R
Let us start with a very basic scatter plot in R where we just pass the x and y parameters to the plot() function without any other options.
plot(x, y)
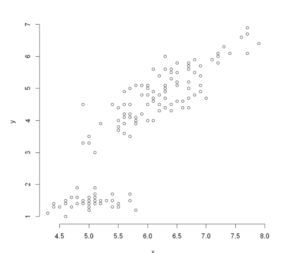
Example 2: Basic Scatterplot without Frame
We can disable the frame in the above example by using frame = False as shown below.
In [3]:
plot(x, y,frame = FALSE)
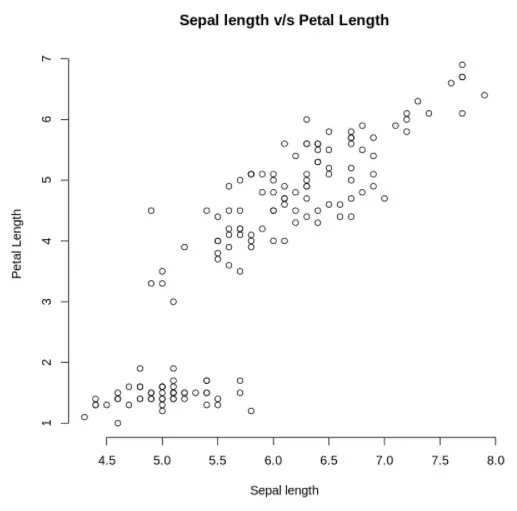
Example 3 : Scatterplot with Label and Titles
Now to include some more detail to our plot, we shall add the main title and corresponding labels. This can be done using the main, xlab, and ylab arguments.
In [4]:
plot(x, y, main = "Sepal length v/s Petal Length",
xlab = "Sepal length", ylab = "Petal Length", frame=FALSE)
Out[4]:
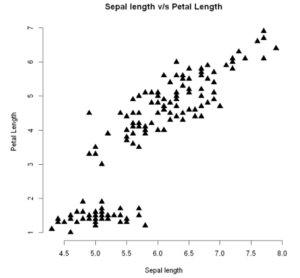
Example 4: Changing Shapes & Size of Scatter Plot Markers in R
To plot our scatterplot with markers of different shapes, we can use the pch argument and pass our desired shape number. The size of the markers can be controlled with cex parameter
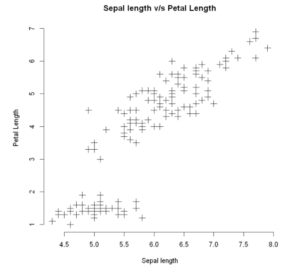
The below two examples show how two different types of markers.
plot(x, y, main = "Sepal length v/s Petal Length",
     xlab = "Sepal length", ylab = "Petal Length",
     pch = 17, cex = 1.5, frame=FALSE)
plot(x, y, main = "Sepal length v/s Petal Length",
     xlab = "Sepal length", ylab = "Petal Length",
     pch = 3, cex = 1.5 , frame=FALSE)
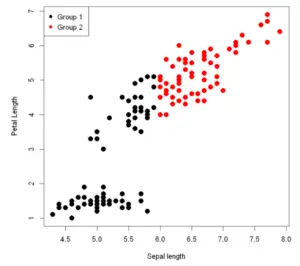
Example 5: Adding Legend to Scatter Plot
To add a legend to the scatter plot, we use a separate legend function. In the legend function, we can define the position, color, and size of the legends to be used for the scatter plot.
In this example, we are grouping the data in Group1 and Group2 based on the condition if the value of x is less than 6 or more. Using this, the legend is assigned.
group <- as.factor(ifelse(x < 6, "Group 1", "Group 2"))

plot(x, y,xlab = "Sepal length", ylab = "Petal Length", pch = 16, col =group, cex=1.5)

legend("topleft",
       legend = c("Group 1", "Group 2"),
       col=1:2,
       pch = 16)
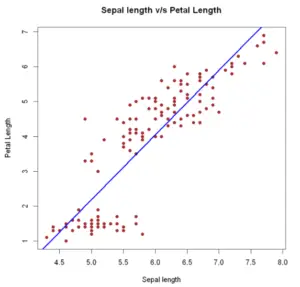
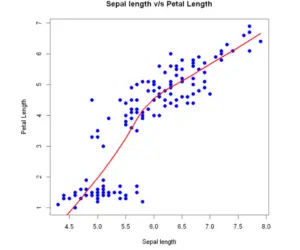
Example 6: Scatter plot with regression line
We add a regression line to a scatter plot passing a lm object to the abline function. Alternatively, we can use locally-weighted polynomial regression. This non-parametric regression estimation can be done with a lowess function.
Add linear fit:
plot(x, y, main = "Sepal length v/s Petal Length",
     xlab = "Sepal length", ylab = "Petal Length",
     pch = 19,col='brown')
abline(lm(y ~ x, data = mtcars), col = "blue", lwd=3)
Add lowess fit:
plot(x, y,main = "Sepal length v/s Petal Length",
     xlab = "Sepal length", ylab = "Petal Length",
     pch = 19, col='blue',cex=1.2)
lines(lowess(x, y), col = "red", lwd=3)
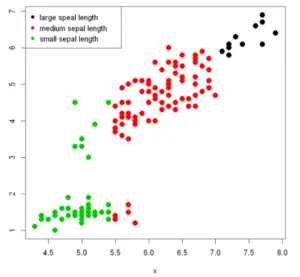
Example 7: Scatter Plot with Groups
Using a grouping variable you can make a scatter plot by group passing the variable, as a factor, into the col argument. As a result, every group will be displayed with a distinct color.
group <- ifelse(x < 5.5, "small sepal length",
                 ifelse(x >7, "large speal length",
                        "medium sepal length"))
# Scatter plot
plot(x, y,
     pch = 19,
     col = factor(group),cex=1.5)

# Legend
legend("topleft",
       legend = levels(factor(group)),
       pch = 19,
       col = factor(levels(factor(group))))
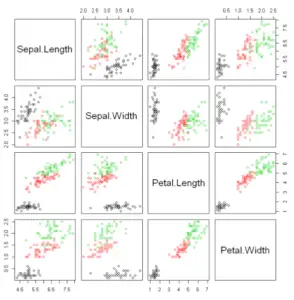
Example 8: Scatter plot matrix
When dealing with multiple variables it is useful to plot multiple scatter plots within a matrix, that will plot each variable against another to visualize the correlation between variables. You can create a scatter plot in R with multiple variables, known as pairwise scatter plots or scatterplot matrix, with the pairs function.
pairs(~Sepal.Length + Sepal.Width + Petal.Length + Petal.Width,col = factor(iris$Species), data =iris)
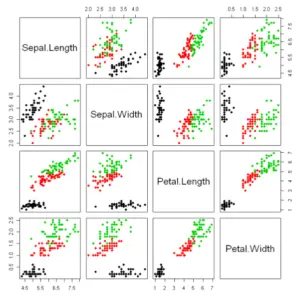
In addition, in case your dataset contains a factor variable, you can specify the variable in the col argument as follows to plot the groups with a different color.
pairs(~Sepal.Length + Sepal.Width + Petal.Length + Petal.Width, col = factor(iris$Species), pch = 19, data =iris)
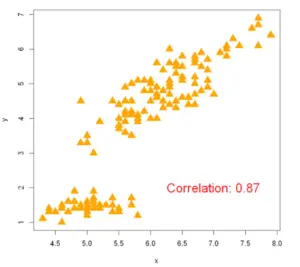
Example 9: Calculate Correlation in Scatter plot
To display the relationship between two quantitative labels we use the correlation metric. Here, to find out the correlation between x and y variables we can use the corr() method in base R.
# Calculate correlation
Corr <- cor(x, y)
# Create the plot and add the calculated value
plot(x, y, pch =17,col='orange', cex=2)
text(paste("Correlation:", round(Corr, 2)), x =7, y =2, cex=1.8, col='red')
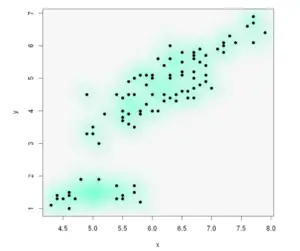
Example 10: Smooth scatterplot with smoothScatter function
The smoothScatter function is a base R function that creates a smooth color kernel density estimation of an R scatterplot.
smoothScatter(x, y, pch = 19,
              transformation = function(x) x ^ 0.5, # Scale
              colramp = colorRampPalette(c("#f7f7f7", "aquamarine"))) # Colors
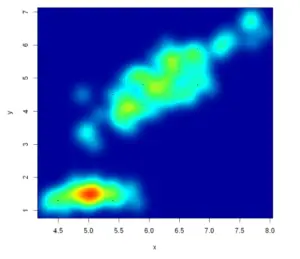
Example 11: Heat map R scatter plot
With the smoothScatter function, you can also create a heat map. For that purpose, you will need to specify a color palette as follows:
smoothScatter(x, y, transformation = function(x) x ^0.9,
              colramp = colorRampPalette(c("#000099", "#00FEFF", "#45FE4F",
                                           "#FCFF00", "#FF9400", "#FF3100")))