Introduction
A line plot is a graph that connects multiple data points by making line segments between them. These points are ordered in one of their coordinate (usually the x-coordinate) values and are useful to investigate trends in our data set. In this tutorial, we are going to see how to create a line plot in R language with plot() function along with its syntax and various examples.
Syntax plot() function for Line Plot in R
Below is the basic syntax of plot() function for creating a line plot with some common parameters. For more details, you can check here.
plot(v, type, main, sub, xlab, ylab, col)
- x – Represents the data to be plotted on x-axis
- y – Represents the data to be plotted on y-axis
- type – when the value is ‘l’ it draws line plot and when the value is ‘o’ or ‘b’ both line and point are drawn
- main – Represents the main title of the line plot
- sub – Represents the subtitle of the line plot
- xlab – Represents label of the x-axis of the line plot
- ylab – Represents label of the y-axis of the line plot
Examples of Line Plot in R Language
Creating Sample Data
Let us create a sample data that can be used in all the subsequent examples of line plot in R.
x <- 1:10
y <- c(3, 1, 5, 2, 3, 8, 4, 7, 6, 9)
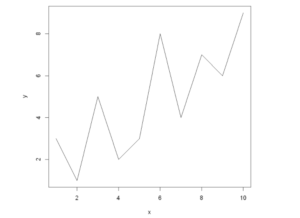
Example 1: Basic Line plot in R
To draw a basic line plot in R, we use the plot function with the specification type = “l”.
Let us see the corresponding R code below:
plot(x,y, type = "l")
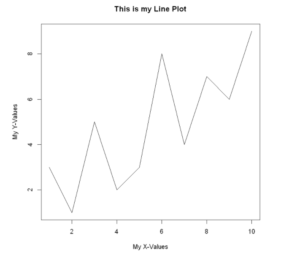
Example 2: Add Main Title & Axis Labels of Line Plot
To set the main title and the axis labels of the line plot we use main, xlab, and ylab arguments in the plot function as shown in the below example.
plot(x, y, type = "l",
     main = "This is my Line Plot",
     xlab = "My X-Values",
     ylab = "My Y-Values")
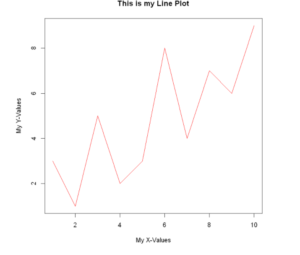
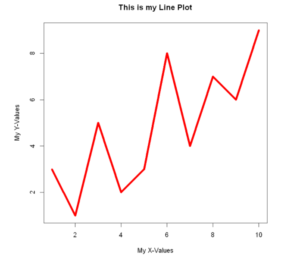
Example 3: Change Color of Line
Let us now change the color of our line plot using the col argument in the plot function in the below example.
plot(x, y, type = "l",
     col = "red", main = "This is my Line Plot",
     xlab = "My X-Values",
     ylab = "My Y-Values")
Example 4: Control Line thickness
We will now use the lwd option to modify our plot’s line thickness.
plot(x, y, type = "l",
     col = "red", lwd=5, main = "This is my Line Plot",
     xlab = "My X-Values",
     ylab = "My Y-Values")
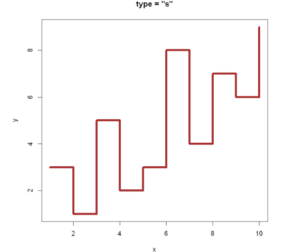
Example 5: Line plot with Type = ‘s’
It’s important to know that Besides type = “l”, there are a few more types of line plots available in base R. Setting type = “s” will create stair steps in the line plot as shown in the below example.
plot(x, y, type = "s", main = 'type = "s"',col = "brown", lwd=5)
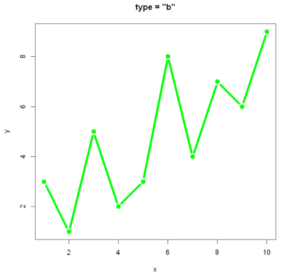
Example 6: Line plot with Type = ‘b’
plot(x, y, type = "b", main = 'type = "b"',col = "green", lwd=5)
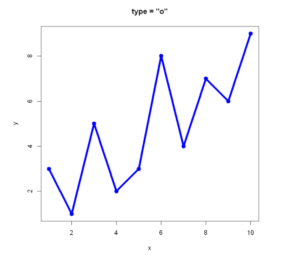
Example 7: Line plot with Type = ‘o’
plot(x, y, type = "b", main = 'type = "o"',col = "green", lwd=5)
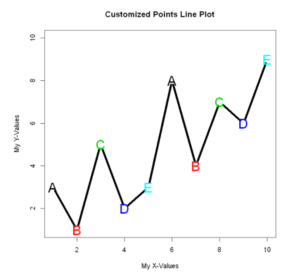
Example 8: Customize the points of Line plot with Letter
In the example below we customize the points of the line plot in R with letters are passing the first five letters of the alphabet.
plot(x, y, type = "b",lwd=5,
     pch = LETTERS[1:5], # Letters as symbols
     cex = 2,            # Size of the symbols
     col = 1:5,          # pch colors
     xlim = c(1, 10),     # X-axis limits
     ylim = c(1, 10), main = "Customized Points Line Plot",
     xlab = "My X-Values",      ylab = "My Y-Values")
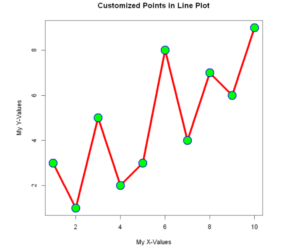
Example 9: Customize the points of Line plot
We can add the points separately to the line plot by using the points function, this allows us to customize the colors of the points as desired.
plot(x, y, type = "l", col = "red",lwd=5, main = "Customized Points in Line Plot",
     xlab = "My X-Values",
     ylab = "My Y-Values")
points(x, y,
       pch = 21,
       cex = 3,
       bg = "green",
       col = "blue",
       lwd = 2)
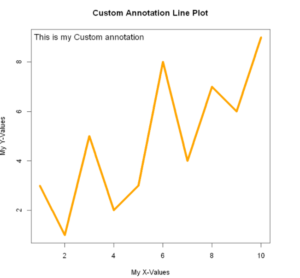
Example 10: Add Custom Annotation to Line plot
In the below example, we add a custom annotation inside the plot by using the text function.
plot(x, y,, type = "l",lwd=5, col = "orange", main = "Custom Annotation Line Plot",
     xlab = "My X-Values",
     ylab = "My Y-Values")
text(x = 3, y =9, "This is my Custom annotation",cex=1.2)
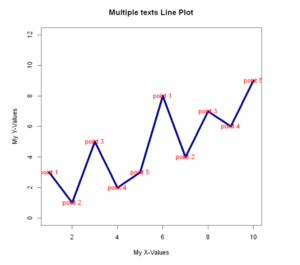
Example 11: Multiple Labels in Line plot
To have multiple labels first, we will define the set of labels we wish to display. After this, we shall pass these labels into the text function along with the x and y coordinates, color, and size of the desired text label.
labels <- c("point 1", "point 2", "point 3", "point 4", "point 5")

plot(x, y, type = "l", lwd=5,col='darkblue',
     xlim = c(1, 10), # X-axis limit
     ylim = c(0,12), main = "Multiple texts Line Plot",
     xlab = "My X-Values",
     ylab = "My Y-Values") # Y-axis limit
text(x = x, y = y, labels, col = 'red',cex=1)
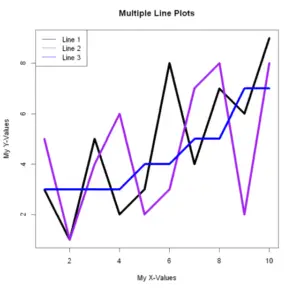
Example 12: Plot multiple Line plots and add Legend
To plot multiple lines to a graph in R. let us first create new variables for our line plot. Then we use the line function for creating two lines with their own customization of color.
y1 <- c(5, 1, 4, 6, 2, 3, 7, 8, 2, 8)
y2 <- c(3, 3, 3, 3, 4, 4, 5, 5, 7, 7)
plot(x, y,lwd=5, type = "l", main = "Multiple Line Plots",
     xlab = "My X-Values",
     ylab = "My Y-Values")
lines(x, y1, type = "l",lwd=5,, col = "purple")
lines(x, y2, type = "l",lwd=5, col = "blue")
legend("topleft",                                       # Add legend to plot
       legend = c("Line 1", "Line 2", "Line 3"),
       col = c("black", "purple", "blue"),
       lty = 1)