Introduction
Base R language can be used to create good visualizations easily out of the box. In this article, we’ll go through the tutorial for creating bar plot in base R programming language. First, the syntax of the barplot() function in R will be explained, and then we will go through different examples of creating barplot with this function.
Syntax of Bar Plot barplot() function in R
Following is the basic syntax of barplot() function in R with some important arguments. The detailed syntax can be found here.
barplot(height, xlab, ylab, main, names.arg, col)
- height – It is a vector or matrix that contains the value used for creating the bar of the plot.
- xlab – It sets the label for x axis.
- ylab – It sets the label for y axis.
- main – It set the title of the barplot.
- names.arg – It sets the names under each bar.
- col – It is used for assigning colors to the bar plot.
Examples of Barplot in R Language
Loading Dataset
The CO2 dataset is built into R that contains the findings of a study on grass cold tolerance. CO2 absorption rate and concentration levels were measured in grass samples from two regions of Quebec and Mississippi, which were grown in either a chilled or nonchilled environment.
This dataset is loaded into the dataframe df as shown below and some of its rows are displayed. This dataset will be
df<-(CO2)
head(df)
| Plant | Type | Treatment | conc | uptake |
|---|---|---|---|---|
| Qn1 | Quebec | nonchilled | 95 | 16.0 |
| Qn1 | Quebec | nonchilled | 175 | 30.4 |
| Qn1 | Quebec | nonchilled | 250 | 34.8 |
| Qn1 | Quebec | nonchilled | 350 | 37.2 |
| Qn1 | Quebec | nonchilled | 500 | 35.3 |
| Qn1 | Quebec | nonchilled | 675 | 39.2 |
data <-df[1:10, "conc"]
Example – 1: Simple Barplot in Base R Language
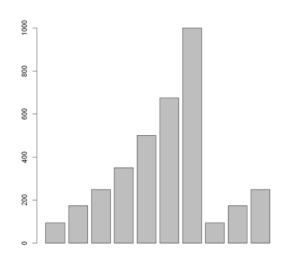
In the below example, we are plotting the basic bar plot in base R by passing the subsetted dataset into the barplot function.
barplot(data)
Example – 2: Horizontal Barplot in Base R Language
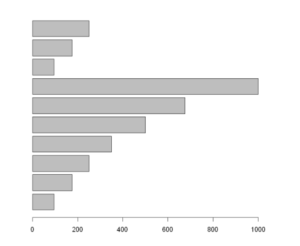
We can create the horizontal bar plot in base R by passing the horiz=TRUE argument as shown in the below example.
# Horizontal bar plot
barplot(data, horiz = TRUE)
Example – 3: Coloring the Barplot with Single Color
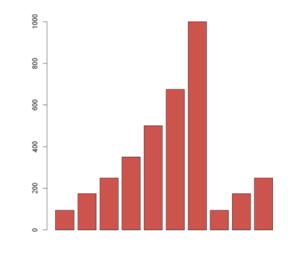
To color the barplot, just use the col parameter and pass the specific color value to fill the plot.
barplot(data, col = "#CD534CFE")
Example – 4: Coloring the Barplot with Multiple Colors
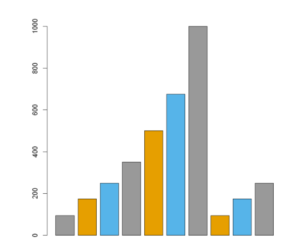
The coloring of the barplot with multiple colors can be done as shown in the below example.
barplot(data, col = c("#999999", "#E69F00", "#56B4E9"))
Example – 5: Coloring the Border of Barplot
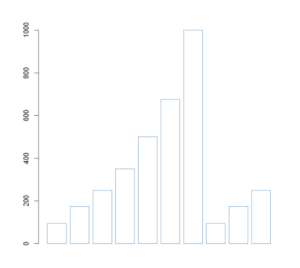
The border of the barplot in R language can be colored with ‘border’ parameter. In the below example. we have colored the barplot with white so that the border color is more prominent.
barplot(data, col = "white", border = "steelblue")
Example – 6: Labeling the Barplot in R
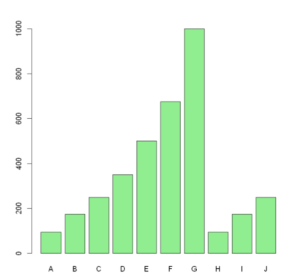
To customize the labeling of our barplot we use the names. arg parameter and pass the desired labels into it.
barplot(data,col ='lightgreen', names.arg = c("A", "B", "C","D",'E','F','G','H','I','J'))
Example – 7: Adding Titles to Barplot in R
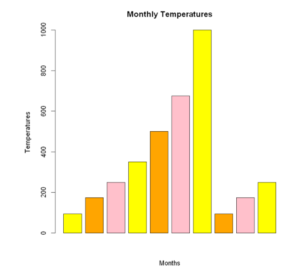
The title of the barplot can be added with ‘main’ parameter and the x & y title can be added with ‘xlab’ and ‘ylab’ parameters respectively.
barplot(data, main = "Monthly Temperatures",
        xlab = "Months", ylab = "Temperatures", col = c("yellow", "orange", "pink"))
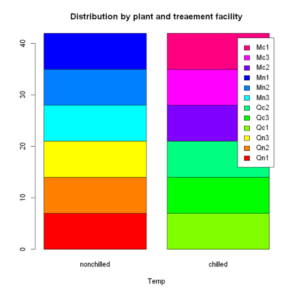
To create the stacked barplot in R, first of all, we apply the table function on Plant and Treatment columns to create a cross table. And then we pass this data to barplot() function as shown below to generate the stacked bar plot.
counts <- table(df$Plant, df$Treatment)
barplot(counts, main="Distribution by plant and treaement facility",
  xlab="Temp", col=rainbow(12),
  legend = rownames(counts))
Example – 8: Grouped Bar Plot in R
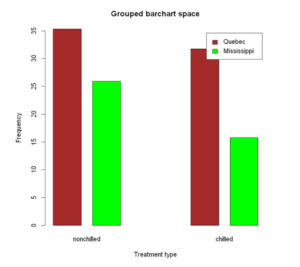
First of all, let us use tapply function to create group summaries. The output of this is shown below.
summary_data <- tapply(df$uptake, list(type = df$Type,
                                       treatment = df$Treatment),
                       FUN = mean, na.rm = TRUE)
summary_data
| nonchilled | chilled | |
|---|---|---|
| Quebec | 35.33333 | 31.75238 |
| Mississippi | 25.95238 | 15.81429 |
barplot(summary_data, xlab = "Treatment type",
        main = "Uptake mean",
        col = rainbow(2),
        beside = TRUE,
        legend.text = rownames(summary_data),
        args.legend = list(title = "Type", x = "topright",
                           inset = c(-0.1,-0.17)))

Example – 9: Applying Spacing in Grouped Barplot
To change the space between bars, in the case of several groups, we can set a two-element vector where the first element is the space between bars of each group (0.4) and the second the space between groups(2.5), as demonstrated below.
barplot(summary_data,
        main = "Grouped barchart space",
        xlab = "Treatment type", ylab = "Frequency",
        col = c("brown", "green"),
        legend.text = rownames(summary_data),
        beside = TRUE,
        space = c(0.4, 2.5))
-
I am passionate about Analytics and I am looking for opportunities to hone my current skills to gain prominence in the field of Data Science.
View all posts


