
Introduction
R has a very popular library ggplot2 for creating beautiful visualizations quite easily. In this article, we will show you a tutorial for creating the bar plot in ggplot2. First, we shall cover the syntax of geom_bar() and cover various examples for creating different types of bar plots with it.
Syntax of Bar Plot in ggplot2
In ggplot2, the following is the minimal syntax for generating the bar plot –
ggplot(<data>, mapping = aes(<mapping>) + geom_bar()
You can customize the bar plot by adding more layers such as themes, labs, etc.
Examples of Bar Plot in R using ggplot2
Loading Dataset
We are going to use the student performance dataset for all examples of the ggplot2 bar plot. It contains various features like gender, ethnicity, parent’s level of education, lunch status, test preparation course, and also has their test scores in math, reading, and writing.
df <- read.table("student.csv",header=TRUE,sep=',')
head(df)
| gender | race.ethnicity | parental.level.of.education | lunch | test. preparation.course | math. score | reading.score | writing.score |
|---|---|---|---|---|---|---|---|
| female | group B | bachelor’s degree | standard | none | 72 | 72 | 74 |
| female | group C | some college | standard | completed | 69 | 90 | 88 |
| female | group B | master’s degree | standard | none | 90 | 95 | 93 |
| male | group A | associate’s degree | free/reduced | none | 47 | 57 | 44 |
| male | group C | some college | standard | none | 76 | 78 | 75 |
| female | group B | associate’s degree | standard | none | 71 | 83 | 78 |
Loading ggplot2
library(ggplot2)
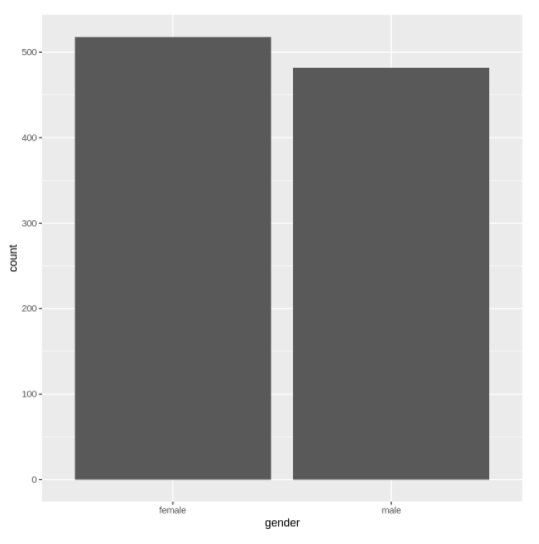
Example 1: Basic Bar Plot in ggplot2
In the below example, we are plotting the very basic bar plot in ggplot2 by passing the dataset along with the mapping of attributes for x and y.
ggplot(data=df, aes(x=gender, y=reading.score)) +
geom_bar(stat="identity")
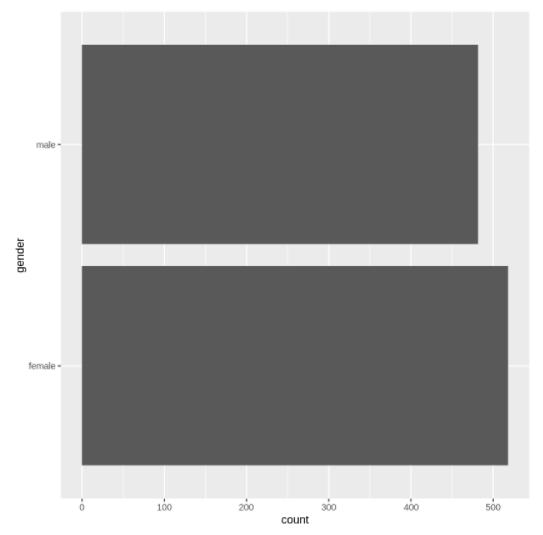
Example 2: Horizontal Bar Plot
ggplot(data=df, aes(x=gender, y=reading.score)) +
geom_bar() + coord_flip()
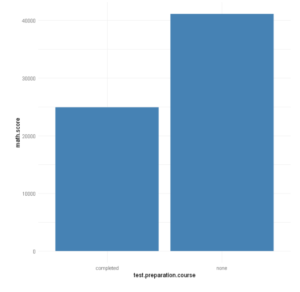
Example 4: Change Color of Bar Plot
The color of bar plot can be changed by using the fill parameter in geom_bar() as shown in the below example.
ggplot(data=df, aes(x=test.preparation.course, y=math.score)) +
geom_bar(stat="identity", fill="steelblue")
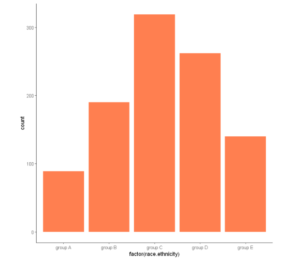
Example 5: Use Themes with Barplot
We can add a theme layer to the barplot as shown in the below example for better appearance. There are many themes available in the ggplot2 library, you can find the list from here.
ggplot(df, aes(x = factor(race.ethnicity))) +
    geom_bar(fill = "coral") +
    theme_classic()
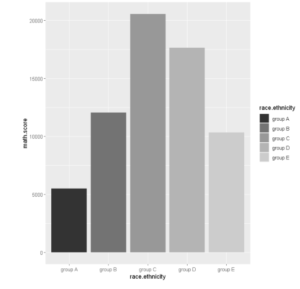
Example 6: Bar Plot with Gray Scale
Shades of gray come out well in print as well as photocopying. To display bar plot only in grayscale, use scale_fill_grey().
ggplot(df, aes(x =race.ethnicity,y=math.score, fill=race.ethnicity)) +
    geom_bar(stat="identity") +
  scale_fill_grey()
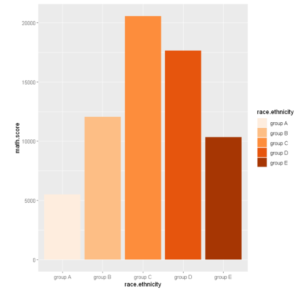
Example 7: Use Color Brewer Palette with Bar Plot
In ggplot2 we can add many color palettes of color brewer with bar plot by using scale_fill_brewer()
ggplot(df, aes(x =race.ethnicity,y=math.score, fill=race.ethnicity)) +
geom_bar(stat="identity") +  scale_fill_brewer(palette="Oranges")
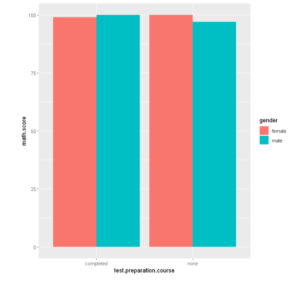
Example 8: Dodge Barplot
You can create plot bars side by side which is also known as a “dodged” plot. To plot a dodged bar plot you need to supply the position = “dodge” argument inside the geom_bar( )
ggplot(df, aes(x =test.preparation.course , y =math.score, fill =gender)) +
geom_bar(stat = "identity", position = "dodge")
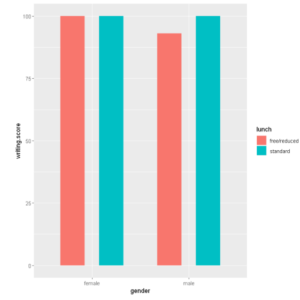
Example 9: Controlling Bar Spacing
To increase the bar spacing, you need to set position_dodge to be larger than the bar width value.
In [9]:
ggplot(data =df, mapping = aes(x =gender, y =writing.score, fill =lunch)) +
geom_bar(stat = "identity", width = 0.5, position = position_dodge(0.8))
- Also Read – Tutorial for Histogram in R using ggplot2 with Examples
- Also Read – Learn Scatter Plot in R using ggplot2 with Examples
- Also Read – Tutorial for Line Plot in R using ggplot2 with Examples

