
In this tutorial, we will explain how to create histogram in R with ggplot2 package which is a very popular open-source package in R for creating visualizations. First of all, we will understand the syntax of geom_histogram() which is the ggplot2 geometric object for creating histograms. Then we will see multiple examples of creating histograms in ggplot2.
Syntax of Scatter Plot in ggplot2
The minimal syntax for creating the scatter plot in ggplot2 is
ggplot(<data>, mapping = aes(<mapping>) + geom_histogram()
ggplot2 lets you add more layers to the plot such as theme, labs, etc. to create more advanced histograms.
Examples of Histogram in R using ggplot2
Loading Library and Dataset
Let us start by loading the ggplot2 library.
We are going to use the stroke dataset for all ggplot2 histogram examples. We load this data into a data frame and check the top rows using the head command.
df <- read.table("stroke.csv",header=TRUE,sep=',')
options( warn = -1 )
head(df)
| id | gender | age | hypertension | heart_disease | ever_married | work_type | Residence_type | avg_glucose_level | BMI | smoking_status | stroke |
|---|---|---|---|---|---|---|---|---|---|---|---|
| 9046 | Male | 67 | 0 | 1 | Yes | Private | Urban | 228.69 | 36.6 | formerly smoked | 1 |
| 51676 | Female | 61 | 0 | 0 | Yes | Self-employed | Rural | 202.21 | N/A | never smoked | 1 |
| 31112 | Male | 80 | 0 | 1 | Yes | Private | Rural | 105.92 | 32.5 | never smoked | 1 |
| 60182 | Female | 49 | 0 | 0 | Yes | Private | Urban | 171.23 | 34.4 | smokes | 1 |
| 1665 | Female | 79 | 1 | 0 | Yes | Self-employed | Rural | 174.12 | 24 | never smoked | 1 |
| 56669 | Male | 81 | 0 | 0 | Yes | Private | Urban | 186.21 | 29 | formerly smoked | 1 |
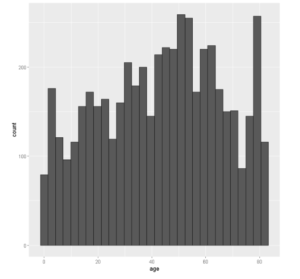
Example 1: Plotting Basic Histogram in ggplot2
Let’s create a basic histogram by passing the data frame to ggplot() along with x=age in the aesthetic mapping. And then we add the layer of geom_histogram().
# Basic histogram
library(ggplot2)
ggplot(df, aes(x=age)) + geom_histogram()
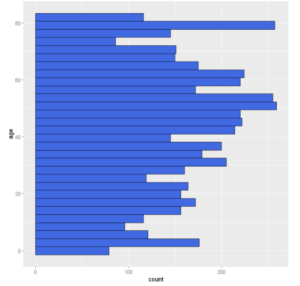
Example 2: Horizontal Histogram in ggplot2
ggplot(df, aes(x=age)) +
geom_histogram(color='black',fill="royalblue")+
coord_flip()
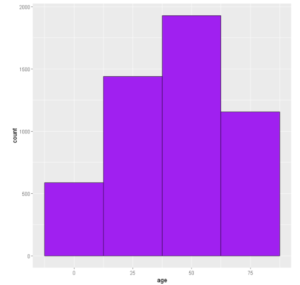
By default, in ggplot2 the size of bin width is 30 for Histogram. We can change it by using binwidth parameter of geom_histogram() as shown below.
# Change the width of bins
ggplot(df, aes(x=age)) +
  geom_histogram(color='black',fill='purple',binwidth=25)
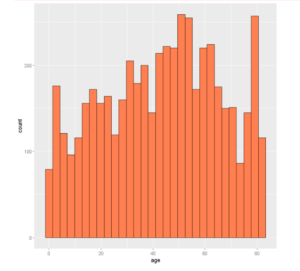
Example 4: Change Color of Histogram
To change the color of our histogram plot we shall pass in the desired color into the fill argument. The color on the lining of these bars can be customized as well using the color argument.
ggplot(df, aes(x=age)) +
  geom_histogram(color="black", fill="coral")
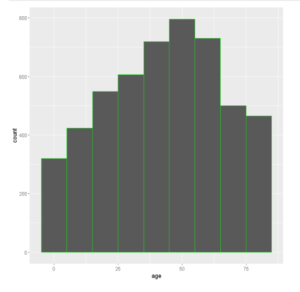
Example 5: Change Border Color in Histogram
The color of the border of the Histogram can be changed with the color parameter of geom_histogram() as shown below in the example –
ggplot(data =df, aes(x =age)) +
  geom_histogram(color = 'green',binwidth=10)
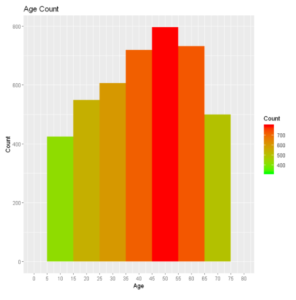
Example 6: Color Gradient Plots
Let us plot our histogram and differentiate the various bars with different count values by displaying a color gradient for the same.
plot_hist <- ggplot(df, aes(x =age)) +
     geom_histogram(aes(fill = ..count..), binwidth = 10)+
     scale_x_continuous(name = "Age", breaks = seq(0, 200,5), limits=c(0, 80)) +
     scale_y_continuous(name = "Count") +
     ggtitle("Age Count") +
     scale_fill_gradient("Count", low = "green", high = "red")

plot_hist
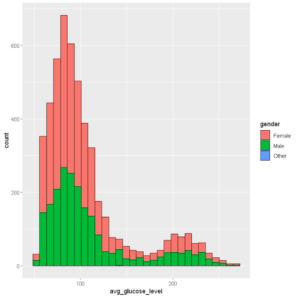
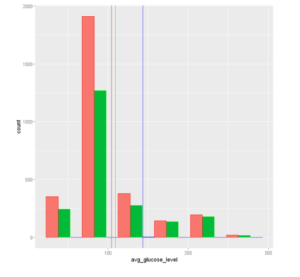
Example 7: Histograms Color By Group
We can assign the attribute to the fill argument on which we want to perform group by in the histogram. In the below example, we pass ‘gender’ to the fill parameter.
ggplot(df, aes(x=avg_glucose_level, fill=gender)) +
  geom_histogram(color='black', alpha=1)
Out[8]:
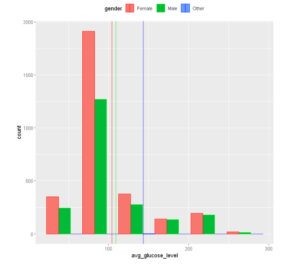
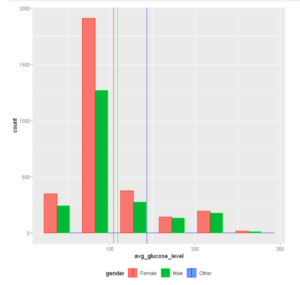
Example 8: Adding Mean Lines to Histogram Plot
We can add mean lines to the Histogram plot in ggplot2 by using geom_vline() as shown below.
# Add mean lines
ggplot(df, aes(x=avg_glucose_level, color=gender,fill=gender)) +
  geom_histogram(position="dodge",binwidth=45)+
  geom_vline(data=avg_gluc, aes(xintercept=grp.mean, color=gender),
             linetype="solid")+ scale_color_manual(values=c("red", "green", "blue")) +
  theme(legend.position="top")
Example 9: Change the Legend Position
We can shift the position of the legend using the legend. position method, further we can pass x and y coordinates to customize a desired location for the legend. (We are using the same plot that we created above.)
p + theme(legend.position="bottom")
Customize position for legend:
p + theme(legend.position = c(0.8, 0.8))
Remove legend altogether:
p + theme(legend.position="none")
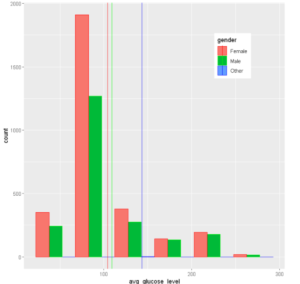
Example 10: Set Axis Limits of Histogram
To specify the range of values allowed in the X-axis and Y-axis, we can use the xlim and ylim parameters.
ggplot(df, aes(x=avg_glucose_level,color=gender,fill=gender)) +                        # Modify x- & y-axis limits
  geom_histogram() +scale_fill_manual(values=c("royalblue", "yellow2", "green"))+xlim(40, 255) +ylim(0, 620)
Out[13]:
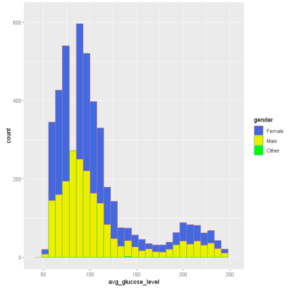
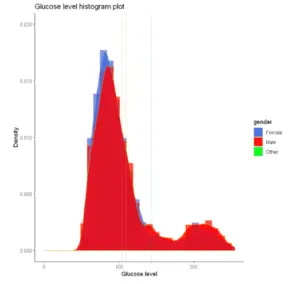
Example 11: Histogram Density Plot in ggplot2
We can also create a histogram density plot in ggplot2 by using geom_density() along with geom_histogram() as shown in the below examples.
# Change line colors by groups
ggplot(df, aes(x=avg_glucose_level,color=gender,fill=gender)) +
geom_histogram(aes(y=..density..), position="identity", alpha=0.7)+
geom_density(alpha=0.8)+
geom_vline(data=avg_gluc, aes(xintercept=grp.mean, color=gender),
           linetype="dashed")+
scale_color_manual(values=c("#999999", "#E69F00", "#56B4E9"))+
scale_fill_manual(values=c("royalblue", "red", "green"))+
labs(title="Glucose level histogram plot",x="Glucose level", y = "Density")+
theme_classic()+xlim(0, 255) +ylim(0,0.02)
- Also Read – Learn Scatter Plot in R using ggplot2 with Examples
- Also Read – Tutorial for Line Plot in R using ggplot2 with Examples
- Reference – ggplot2 Documentation

