
Introduction
In this article, we will go through the matplotlib boxplot tutorial that will be helpful to understand the data distribution in your data science and machine learning project. We will cover many examples in this tutorial for creating different types of boxplot using the matplotlib library. We will also tell you the significance of different parameters that are used in matplotlib’s boxplot function. So let’s start this tutorial.
Importing Matplotlib Library
Before beginning with this matplotlib bar plot tutorial, we’ll need Matplotlib Library. So let’s import Matplotlib
import matplotlib.pyplot as plt
import numpy as np
Matplotlib Boxplot Tutorial
Box plot is a graph used for showing the shape of the distribution. Box Plot also tells us about the central value and variance of data. First, we’ll look at the syntax of box plot function.
Syntax of Boxplot Function in Matploltib
matplotlib.pyplot.boxplot(x, notch=None, sym=None, vert=None, whis=None, positions=None, widths=None, patch_artist=None, bootstrap=None, usermedians=None, conf_intervals=None, meanline=None, showmeans=None, showcaps=None, showbox=None, showfliers=None, boxprops=None, labels=None, flierprops=None, medianprops=None, meanprops=None, capprops=None, whiskerprops=None, manage_ticks=True, autorange=False, zorder=None, *, data=None)
- x : Array or a sequence of vectors – This parameter takes the input.
- notch : bool, default: False – This parameter decides whether a notched box plot will be drawn or a rectangular box plot will be drawn. If passed True, former is drawn, otherwise latter is drawn.
- sym : Str, optional – This is the default symbol for flier points. An empty string (”) hides the fliers. If None, then the fliers default to ‘b+’.
- vert : bool, default : True – If passed as True, vertical boxes are drawn. If passed False, horizontal boxes are drawn.
- whis : float or (float, float), default: 1.5 – This parameter decides the position of whiskers.
- bootstrap : int, optional – Using this, we can bootstrap the confidence intervals around median for notched boxplots.
- usermedians : array-like, optional – This is the set of medians value used.
- conf_intervals : array-like, optional – This set of parameters is used for setting the notch values.
- positions : array-like, optional – Used for setting the position of boxes.
- widths : floats or array-like – This sets the width of each box.
- label : sequence, optional – This helps in setting the label for each dataset.
- manage_ticks : bool, default: True – For aligning the tick locations and labebls.
- autorange : bool, default:False – This helps is setting the range and position of whiskers.
[adrotate banner=”3″]
Example 1: Simple Matplotlib Boxplot
Here in this example, we will look at how the matplotlib boxplot function can be used. First, we’ll generate random data using numpy library, and after this random data is fed into the boxplot function of matplotlib. Remember we are calling the normal function in numpy to generate a random sample of data from normally distributed data.
The boxplot produced has a box that depicts the major distribution of data, the whiskers at both ends i.e. top and bottom depict the outliers present in data.
# Creating dataset
np.random.seed(150)
data = np.random.normal(150, 25, 250)

fig = plt.figure(figsize =(10, 7))

# Creating plot
plt.boxplot(data)

# show plot
plt.show()

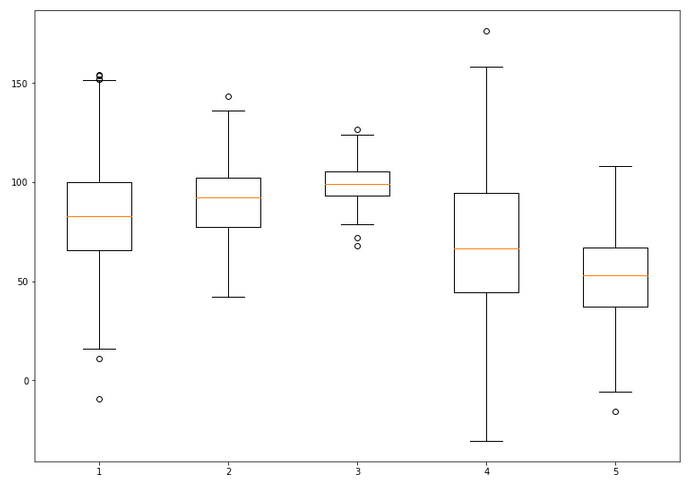
Example 2: Multiple Box Plots in Matplotlib
We can also build multiple box plots that will help in comparing data of different groups. In this case, we generate normally distributed data for different boxes and pass this data to the boxplot function.
# Creating dataset
np.random.seed(10)

data_1 = np.random.normal(80, 30, 200)
data_2 = np.random.normal(90, 20, 200)
data_3 = np.random.normal(100, 10, 200)
data_4 = np.random.normal(70, 40, 200)
data_5 = np.random.normal(55, 25, 200)
data = [data_1, data_2, data_3, data_4, data_5]

fig = plt.figure(figsize =(10, 7))

# Creating axes instance
ax = fig.add_axes([0, 0, 1, 1])

# Creating plot
bp = ax.boxplot(data)

# show plot
plt.show()
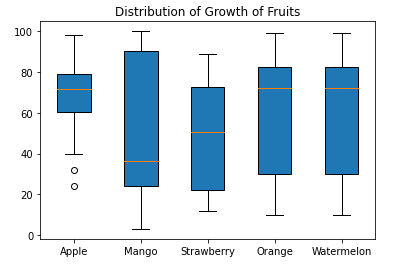
Example 3: Matplotlib boxplot Color Customization
The 3rd example talks about the patch_artist parameter of the matplotlib boxplot function for color customization. This parameter will help in visualizing the boxplot with the help of Line2d artist. This basically means the boxes will be filled with color as compared to the previous example where empty boxes were present.
value1 = [82,76,24,40,67,62,75,78,71,32,98,89,78,67,72,82,87,66,56,52]
value2=[62,5,91,25,36,32,96,95,3,90,95,32,27,55,100,15,71,11,37,21]
value3=[23,89,12,78,72,89,25,69,68,86,19,49,15,16,16,75,65,31,25,52]
value4=[59,73,70,16,81,61,88,98,10,87,29,72,16,23,72,88,78,99,75,30]
value5=[30,59,73,70,16,81,61,88,98,10,87,29,72,16,23,72,88,78,99,75]

box_plot_data=[value1,value2,value3,value4,value5]
plt.title("Distribution of Growth of Fruits")
plt.boxplot(box_plot_data,patch_artist=True,labels=['Apple','Mango','Strawberry','Orange','Watermelon'])
plt.show()
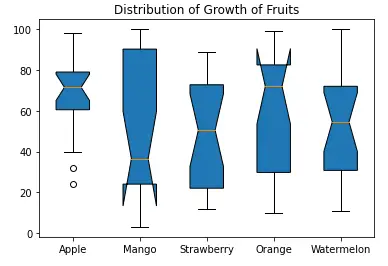
Example 4: Box Plot with Notches
In this example, we’ll see how we can add notches to our box plots. The notches basically convey the valuable information about the significance of difference medians of two different box plots.
Again to build boxplot with notches, we can pass the notch parameter, value of True, in boxplot function. In this way, we can first generate random data and then create notches.
value1 = [82,76,24,40,67,62,75,78,71,32,98,89,78,67,72,82,87,66,56,52]
value2=[62,5,91,25,36,32,96,95,3,90,95,32,27,55,100,15,71,11,37,21]
value3=[23,89,12,78,72,89,25,69,68,86,19,49,15,16,16,75,65,31,25,52]
value4=[59,73,70,16,81,61,88,98,10,87,29,72,16,23,72,88,78,99,75,30]
value5=[32,27,55,100,15,71,11,37,21,82,76,24,40,67,62,75,78,71,32,54]

box_plot_data=[value1,value2,value3,value4,value5]
plt.title("Distribution of Growth of Fruits")
plt.boxplot(box_plot_data,notch='True',patch_artist=True,labels=['Apple','Mango','Strawberry','Orange','Watermelon'])
plt.show()
Example 5: Horizontal Box Plots with Varying Length and Color of Whiskers
The last example of this matplotlib tutorial on box plot will tell us how we can build horizontal box plots, the previous examples have been revolving around vertical boxplots. Once random data is generated and we have called subplot function to plot this graph. For plotting horizontal box plots, we have to pass ‘0’ to vert parameter, we will have horizontal boxplots.
With the help of for loop, we can change the appearance and linewidth of whiskers, appearance of caps, appearance of medians and fliers.
# Creating dataset
np.random.seed(10)
data_1 = np.random.normal(60, 30, 450)
data_2 = np.random.normal(190, 20, 450)
data_3 = np.random.normal(80, 50, 450)
data_4 = np.random.normal(100, 40, 450)
data = [data_1, data_2, data_3, data_4]

fig = plt.figure(figsize =(10, 7))
ax = fig.add_subplot(111)

# Creating axes instance
bp = ax.boxplot(data, patch_artist = True, notch ='True', vert = 0)

colors = ['purple', 'cyan', 'lime', 'blue']

for patch, color in zip(bp['boxes'], colors): patch.set_facecolor(color)

# changing color and linewidth of whiskers
for whisker in bp['whiskers']: whisker.set(color ='#8B008B', linewidth = 1.5, linestyle =":")

# changing color and linewidth of caps
for cap in bp['caps']: cap.set(color ='#8B008B', linewidth = 2)

# changing color and linewidth of medians
for median in bp['medians']: median.set(color ='red', linewidth = 3)

# changing style of fliers
for flier in bp['fliers']: flier.set(marker ='D', color ='#e7298a', alpha = 0.5)

# x-axis labels
ax.set_yticklabels(['data_1', 'data_2', 'data_3', 'data_4'])

# Adding title
plt.title("Customized Box Plot with Labels")

# Removing top axes and right axes ticks
ax.get_xaxis().tick_bottom()
ax.get_yaxis().tick_left()

# show plot
plt.show(bp)

- Also Read – Matplotlib Bar Plot – Complete Tutorial For Beginners
- Also Read – Matplotlib Scatter Plot – Complete Tutorial
- Also Read – Matplotlib Line Plot – Complete Tutorial for Beginners
- Also Read – Matplotlib Pie Chart – Complete Tutorial for Beginners
- Also Read – Matplotlib Animation – An Introduction for Beginners
- Also Read – 11 Python Data Visualization Libraries Data Scientists should know
Conclusion
This boxplot tutorial using matplotlib was a complete lesson on how one can build several kinds of boxplots with the help of matplotlib. We learned about the usage of different parameters of the boxplot function. The tutorial also talked about how one can make vertical and horizontal boxplots.
Reference – Matplotlib Documentation

