
Data science is the study of data to extract knowledge and insights from the data and apply knowledge and actionable insights. In this tutorial, we will work on IPL Data Analysis and Visualization Project using Python where we will explore interesting insights from the data of IPL matches like most run by a player, most wicket taken by a player, and much more from IPL season 2008-2020.
So if you are an IPL cricket fan and love data analysis with Python this project is perfect for you.
Importing Libraries
In this tutorial, we will use NumPy and Pandas libraries of Python for data analysis and for data visualization Seaborn and Matplotlib libraries.
import math
import numpy as np
import pandas as pd
import seaborn as sns
import matplotlib.pyplot as plt
%matplotlib inline
IPL Dataset
Our IPL dataset contains ball by ball records from the first match played in the 2008 season till the complete 2020 season.
Importing IPL Dataset
We have imported the CSV dataset below with the help of pandas read_csv functions We can see the content of the dataset by using head() function.
df=pd.read_csv('data.csv')
df.head()
Checking IPL Dataset Attributes
Before we proceed with our Python data analysis of IPL data, we should know what columns are present in the dataset, their count, and data type. For this, we use Pandas info() function.
df.info()
IPL Data Analysis and Visualization with Python
Now, with a basic understanding of the attributes let us now start our project of data analysis and visualization of the IPL dataset with Python. We will initially perform simple statistical analysis and then slowly build to more advanced analysis.
i) General Analysis of IPL Matches
1. List of Seasons
We can get the list of seasons from the dataset by applying unique() function on the season column which confirms that our dataset contains data of matches played from season 2008-2020.
The data set we have includes the data of each and every match played from season 2008 to 2021.
df['season'].unique()
2. First ball of IPL history
Each data point describes the match_id, season, start_date, venue, innings, ball, batting_team, bowling_team, striker, non_striker, bowler, runs_off_bat, extras, wides, no balls, byes, leg byes, wicket_type, player_dismissed, run which are self-explanatory.
Here we have fetched the first row of the data sets which corresponds to the first ball of the first match of IPL history played between KKR and RCB played on 4th July 2008.
df.iloc[0]
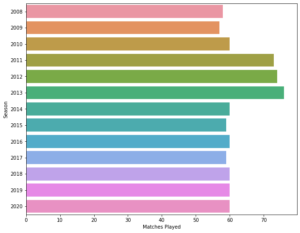
3. Season Wise IPL Matches
We can find the number of matches played in each season by grouping the match_id, season column and counting out the data, and then calling the index out of it by dropping the first index layer that is the match_id.
We can see the visualization of the IPL matches using the Matlotlib library.
plt.figure(figsize=(10,8))
data = df.groupby(['match_id','season']).count().index.droplevel(level=0).value_counts().sort_index()
sns.barplot(y=data.index,x=data,orient='h')
plt.xlabel('Matches Played')
plt.ylabel('Season')
plt.show()
4. Most IPL Matches played in a Venue
The analysis shows most of the IPL matches were played in Chennai, Mumbai, Kolkata, Banglore, and Delhi.
df.groupby(['venue','match_id']).count().droplevel(level=1).index.value_counts()
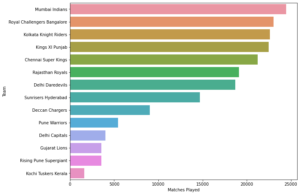
5. IPL Matches Played by Each Team
We can find out the matches played by each team by the same process which is grouping the batting_team and the match_id column and counting the data and then dropping the first index layer which is match_id.
plt.figure(figsize=(10,8))
data = df['bowling_team'].value_counts().sort_values(ascending=False)
sns.barplot(y=data.index,x=data,orient='h')
plt.xlabel('Matches Played')
plt.ylabel('Team')
plt.show()
ii) IPL Batting Analysis
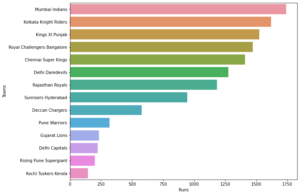
6. Most Run Scored by IPL Teams
To calculate the most run scored by a team across all seasons we have grouped by Team and have summed up the run scored by them. And finally, sort them in descending order.
Without any surprise, MI is at the top of the list.
df.groupby(['batting_team'])['run'].sum().sort_values(ascending=False)
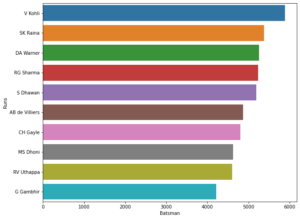
7. Most IPL Runs by a Batsman
From the below visualization we can see that the Run-Machine, Virat Kohli is at the top of this list with more than 6,000 runs followed by Suresh Raina and Shikhar Dhawan.
plt.figure(figsize=(10,8))
data = df.groupby(['striker'])['runs_off_bat'].sum().sort_values(ascending=False)[:10]
sns.barplot(y=data.index,x=data,orient='h')
plt.xlabel('Batsman')
plt.ylabel('Runs')
plt.show()
8. Avg Run by Teams in Powerplay
Team Delhi Capital has the best average in the powerplay with an average of 48 runs followed by SRH and RPS.
df[df['over']<6].groupby(['match_id','batting_team']).sum()['run'].groupby('batting_team').mean().sort_values(ascending=False)[2:]
9. Most IPL Century by a Player
The Universe Boss Chris Gayle is at the top of the list in scoring the most number of centuries in IPL history. He has hit six tons and has scored 4804 runs in IPL.
His former teammate Virat Kohli has scored five hundred’s and he is at the second spot in the list followed by Watson, AB de Villiers, Brendon McCullum, and David Warner.
This can be calculated by grouping the columns striker and match_id and then calculating the sum.
runs = df.groupby(['striker','match_id'])['runs_off_bat'].sum()
runs[runs >= 100].droplevel(level=1).groupby('striker').count().sort_values(ascending=False)[:10]
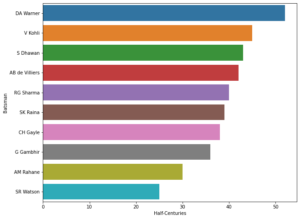
10. Most IPL Fifty by Player
When a number of the fifties comes Warner is top in the list followed by Virat Kohli and Shikhar Dhawan. This will also be calculated by the same method as above, plus we have shown a bar graph visualization for better representation.
plt.figure(figsize=(10,8))
runs = df.groupby(['striker','start_date'])['runs_off_bat'].sum()
data = runs[runs >= 50].droplevel(level=1).groupby('striker').count().sort_values(ascending=False)[:10]
sns.barplot(y=data.index,x=data,orient='h')
plt.xlabel('Half-Centuries')
plt.ylabel('Batsman')
plt.show()
11. Orange Cap Holder Each Season
The batsman with the most runs in the tournament during the course of the season would wear the Orange Cap while fielding, with the overall leading run-scorer at the conclusion of the tournament winning the actual Orange Cap award on the day of the season’s final.
Shaun Marsh became the first winner of the award in 2008, the complete list is presented below from the dataset.
data = df.groupby(['season','striker'])['runs_off_bat'].sum().groupby('season').max()
temp_df=pd.DataFrame(df.groupby(['season','striker'])['runs_off_bat'].sum())
print("{0:10}{1:20}{2:30}".format("Season","Player","Runs"))
for season,run in data.items():
    player = temp_df.loc[season][temp_df.loc[season]['runs_off_bat'] == run].index[0]
    print(season,'\t ',player,'\t\t',run)
12. Most Sixes in an IPL Inning
Chris Gayle has hit the highest number of sixes in an inning with the number being 17 in the entire IPL history. Followed by Brendon McCullum and AB De Villiers.
df[df['runs_off_bat'] == 6].groupby(['start_date','striker']).count()['season'].sort_values(ascending=False).droplevel(level=0)[:10]
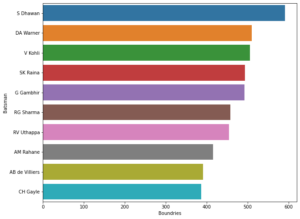
13. Most Boundary (4s) hit by a Batsman
The Indian Gabbar, Shikhar Dhawan is at the top of the list with more than 600 boundaries followed by Virat Kohli and David warner.
plt.figure(figsize=(10,8))
data = df[df['runs_off_bat'] == 4]['striker'].value_counts()[:10]
sns.barplot(y=data.index,x=data,orient='h')
plt.xlabel('Fours')
plt.ylabel('Batsman')
plt.show()
14. Most runs in an IPL season by Player
The run machine, Virat Kohli is at the top of the list with 973 runs in 2016 season followed by David Warner and Kane Williamson with 848 and 735 runs in the 2016 and 2018 season respectively.
df.groupby(['striker','season'])['runs_off_bat'].sum().sort_values(ascending=False)[:10]
15. No. of Sixes in IPL Seasons
2018 is the season with the most number of sixes hit. Followed by season 2019 and 2020 in the list of most sixes in a season.
plt.figure(figsize=(10,8))
data = df[df['runs_off_bat'] == 6].groupby('season').count()['match_id'].sort_values(ascending=False)
sns.barplot(y=data.index,x=data,orient='h')
plt.xlabel('Sixes')
plt.ylabel('Season')
plt.show()
16. Highest Total by IPL Teams
Royal Challengers Bangalore is at the top of the list of highest run by a team. The match was played against Pune Warrior in the 2019 season.
df.groupby(['start_date','batting_team']).sum()['run'].droplevel(level=0).sort_values(ascending=False)[:10]
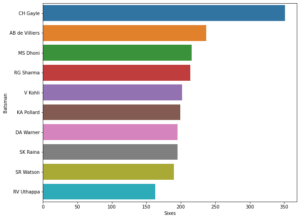
17. Most IPL Sixes Hit by a batsman
The universe Boss, Chris gale is at the top of the list in the most hitting sixes followed by AB De Villiers and MS Dhoni
plt.figure(figsize=(10,8))
data = df[df['runs_off_bat'] == 6]['striker'].value_counts()[:10]
sns.barplot(y=data.index,x=data,orient='h')
plt.xlabel('Sixes')
plt.ylabel('Batsman')
plt.show()
Chris Gayle playing against Pune Warrior has hit the highest individual score in the 2013 season. Brendon McCullum and Ab de Villiers are in the second and third positions on the list.
df.groupby(['striker','start_date'])['runs_off_bat'].sum().sort_values(ascending=False)[:10]
iii) Bowling Statistics
19. Most run conceded by a bowler in an inning
Basil Thampi playing for SRH against RCB in the 2008 season has conceded 70 runs and is at the top of the list followed by Bangladesh player Mujeeb Ur Rahman and Ishant Sharma.
df.groupby(['bowler','start_date'])['run'].sum().droplevel(level=1).sort_values(ascending=False)[:10]
20. Purple Cap Holders
The bowler with the most wickets in the tournament during the course of the season would wear the Purple Cap while fielding, with the overall leading wicket-taker at the conclusion of the tournament winning the actual Purple Cap award on the day of the season’s final.
Below is the list of bowlers with purple caps.
lst = 'caught,bowled,lbw,stumped,caught and bowled,hit wicket'
data = df[df['wicket_type'].apply(lambda x: True if x in lst and x != ' ' else False)].groupby(['season','bowler']).count()['ball']
data=data.sort_values(ascending=False)[:30].sort_index(level=0)
val=0
lst=[]
print("{0:10}{1:20}{2:30}".format("Season","Player","Runs"))
for (season,bowler),wicket in data.items():
    if season == val:
        lst.append(wicket)
    else:
        print(season,'\t ',bowler,'\t\t',wicket)
        val = season
        lst=[]
21. Most IPL Wickets by a Bowler
Srilankan bowler Malinga is at the top of the list with 170 wickets followed by Amit Mishra and Push Chawla with 160 and 156 wickets respectively.
lst = 'caught,bowled,lbw,stumped,caught and bowled,hit wicket'
df[df['wicket_type'].apply(lambda x: True if x in lst and x != ' ' else False)]['bowler'].value_counts()[:10]
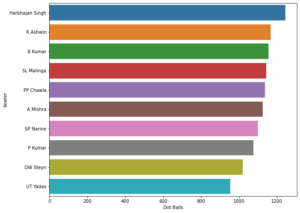
22. Most Dot Ball by a Bowler
The Indian bowler Harbhajan Singh has bowled the most number of Dot balls followed by R. Ashwin and Bhuvneshwar Kumar
plt.figure(figsize=(10,8))
data = df[df['run'] == 0].groupby('bowler').count()['match_id'].sort_values(ascending=False)[:10]
sns.barplot(y=data.index,x=data,orient='h')
plt.xlabel('Dot Balls')
plt.ylabel('bowler')
plt.show()
23. Most Maiden over by a Bowler
Indian right-hand medium-pacer bowler Praveen Kumar is at the top of the list with the most maiden overs followed by Irfan Pathan and Dale Stain.
data = df.groupby(['start_date','bowler','over'])['run'].sum()
data = data[data.values == 0].droplevel(level=[0,2])
data.index.value_counts()[:10]
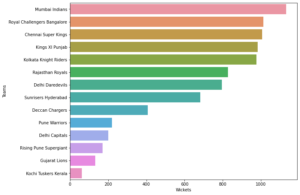
24. Most Wickets by an IPL Team
The Mumbai Indian has taken the most number of wickets in IPL followed by Royal Challengers Banglore and Chennai Super Kings
plt.figure(figsize=(10,8))
lst = 'caught,bowled,lbw,stumped,caught and bowled,hit wicket'
data = df[df['wicket_type'].apply(lambda x: True if x in lst and x != ' ' else False)]['bowling_team'].value_counts()
df.groupby(['batting_team'])['extras'].agg('sum').sort_values(ascending=False)
sns.barplot(y=data.index,x=data,orient='h')
plt.xlabel('Wickets')
plt.ylabel('Teams')
plt.show()
25. Most No Balls by an IPL team
Royal Challengers Bangalore has given most no balls followed by Mumbai Indians and Chennai Super Kings
df.groupby(['batting_team'])['noballs'].agg('sum').sort_values(ascending=False)
26. Most No Balls by an IPL Bowler
Indian bowler S Sreesanth has bowled the most number of no balls followed by Jasprit Bumrah and Amit Mishra
df[df['noballs'] != 0]['bowler'].value_counts()[:10]
27. Most run given by a team in Extras
Mumbai Indians have given the most number of extras (byes, no balls, wides) followed by Kolkata Knight Riders and Kings XI Punjab.
plt.figure(figsize=(10,8))
data = df.groupby(['batting_team'])['extras'].agg('sum').sort_values(ascending=False)
sns.barplot(y=data.index,x=data,orient='h')
plt.xlabel('Runs')
plt.ylabel('Teams')
plt.show()
28. Most Wides Conceded by an IPL team
Mumbai Indians has given most wides followed by Kolkata Knight Riders and Royal Challengers Bangalore
df.groupby(['batting_team'])['wides'].agg('sum').sort_values(ascending=False)
- Also Read – Machine Learning Projects in Python with Code in GitHub to give you Ideas
- Also Read – 13 Cool Computer Vision GitHub Projects To Inspire You
- Also Read – 11 Interesting Natural Language Processing GitHub Projects To Inspire You
- Also Read – 7 Reinforcement Learning GitHub Repositories To Give You Project Ideas
Conclusion
Hope you liked our project on IPL Data analysis and Visualization using Python. We just listed some basics to medium-advanced analysis over here, to give you an idea of how to use the data set. You can come up with your own data analysis of IPL data with Python libraries and even do some machine learning projects.
IPL Dataset Download
The IPL dataset used in this tutorial can be downloaded from this link. Enjoy exploring it!


9 Responses
Hey !! Can I get the data set
Hello Sameer you can find the dataset on Kaggle.
Hey!! Can i get the same dataset which is used in this program. please send the link or the dataset same as used in this. i couldn’t found on kaggle. please help.
Hello Vishwajeet, the link for downloading the IPL dataset used in this tutorial has been updated at the end of the article.
Thank You so much.
link pls
Hello, the link for downloading the IPL dataset used in this tutorial has been updated at the end of the article.
The link for downloading the IPL dataset used in this tutorial has been updated at the end of the article.
Hey!! I am getting this error TypeError: ‘in ‘ requires string as left operand, not float. In program no 20. purple cap Holders, please help.