Introduction
In this article, we will go through the tutorial of Seaborn distplot which is a kind of distribution plot for univariate distribution of observation. We will cover the syntax of sns.distplot() and its parameter along with different examples of it like rugplot, KDE, etc.
So let’s start the tutorial and learn about this visualization.
Syntax of Distplot in Seaborn
seaborn.distplot(a=None, bins=None, hist=True, kde=True, rug=False, fit=None, hist_kws=None, kde_kws=None, rug_kws=None, fit_kws=None, color=None, vertical=False, norm_hist=False, axlabel=None, label=None, ax=None, x=None)
- a : Series, 1d-array, or list.
This parameter takes the data for building the plot. - bins : argument for matplotlib hist(), or None, optional
Using this parameter, we set the value of bins. - hist : bool, optional
This parameter will tell whether a normed histogram has to be build or not. - kde : bool, optional
Through this, we can decide whether kernel density estimate plot should be plotted or not. - rug : bool, optional
Through this, we can decide whether rug plot should be plotted or not. - hist_kws : dict, optional
These are the keyword arguments for hist() function - kde_kws : dict, optional
These are the keyword arguments for kdeplot() function - rug_kws : dict, optional
These are the keyword arguments for rugplot() function - color : matplotlib color, optional
Here we can provide the color for the plot apart from the curve. - vertical : bool, optional
If set to true, then the values will be placed on y-axis. - norm_hist : bool, optional
This helps in displaying histogram as density instead of count. - axlabel : string, False, or None, optional
Here we can provide the names for axis of the plot.
Seaborn Distplot Example
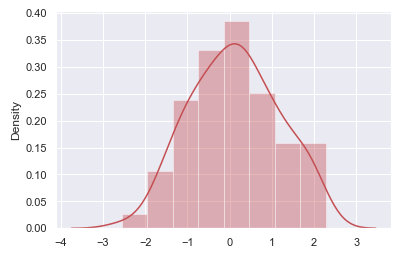
1st Example – Distplot with KDE and Histogram
In this first example, we are importing the necessary libraries. Then, we generate random data that is consequently used for plotting distplot. We assign a color scheme with the help of the color parameter.
import seaborn as sns, numpy as np

sns.set_theme();

np.random.seed(0)

x = np.random.randn(125)

ax = sns.distplot(x, color="r")

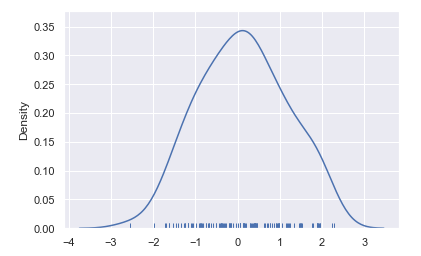
2nd Example – Distplot with Rug Plot Parameter
For plotting a rug plot, we have to set the rug parameter to true in distplot() and in this way, the desired plot is obtained. Since hist parameter is set as False, the final visualization will not have a histogram in it.
import matplotlib.pyplot as plt
import seaborn as sns, numpy as np

ax = sns.distplot(x, rug=True, hist=False)

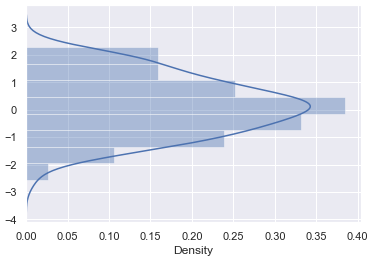
3rd Example – Horizontal Distplot in Seaborn
The 3rd example will show how can we plot a horizontal distplot. Here we just have to use the vertical parameter which is set to True for plotting horizontal distplot.
ax = sns.distplot(x, vertical=True)

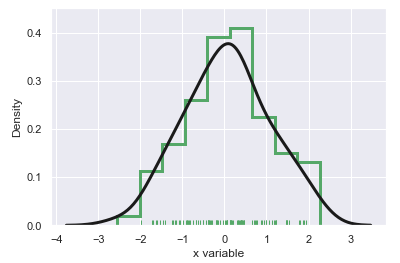
4th Example – Distplot with Rug, KDE and Histogram plot
In this 4th example, we are combining the distplot with rug, KDE, and histogram plot. We have specified the color for rug plot, line width and color for KDE plot, and histogram type, line width, alpha, color for histogram plot.
ax = sns.distplot(x, rug=True, rug_kws={"color": "g"},

                  kde_kws={"color": "k", "lw": 3, "label": "KDE"},

                  hist_kws={"histtype": "step", "linewidth": 3,

                            "alpha": 1, "color": "y"})

Conclusion
It’s time to end this seaborn tutorial on distplot. In this we looked at the syntax of distplot, parameters that affect the distplot in various ways, different examples of distplot like rug, KDE, etc. are also shown.
Reference: https://seaborn.pydata.org/
-
I am Palash Sharma, an undergraduate student who loves to explore and garner in-depth knowledge in the fields like Artificial Intelligence and Machine Learning. I am captivated by the wonders these fields have produced with their novel implementations. With this, I have a desire to share my knowledge with others in all my capacity.
View all posts


