

Introduction
In our earlier post Types of Machine Learning we gave a high level view of Supervised Learning as one of the paradigms within machine learning. Now let us go one step below and try to understand different types of Supervised Learning.
This will be a simple read to help build intuitive understanding especially for beginners.
Supervised Learning Types
Supervised Learning has two main categories and each of these are used to solve two different class of problems –
- Regression – In this type of problem, machine tries to predict a continuous number for given inputs based on its earlier supervised training
- Classification – In this type of problem, machine tries to predict a category for given inputs based on its earlier supervised training.
Let us understand these two types with more details with the help of examples.
Regression
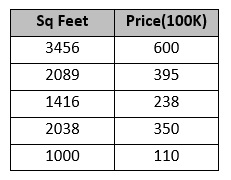
For example sake, let us assume that we have price data of 25 houses according to their area in sq. feet – below are few sample data.
Now if we plot the house Price Vs Sq feet, we get the following graph –
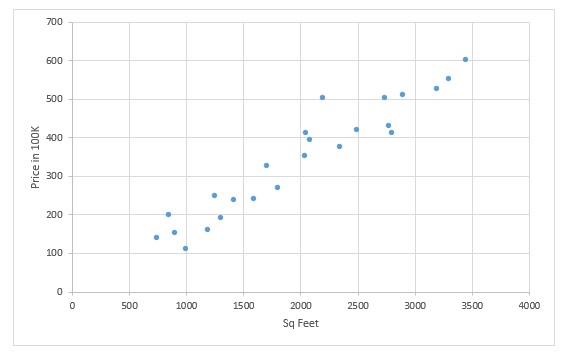
First we should understand is that Price is dependent on Sq. Feet area of house. So we can say that Price is a function of Sq Feet.
This can be denoted in a mathematical term of y=f(x) as
Price = f(Sq Feet) { y is Price and x is Sq Feet }
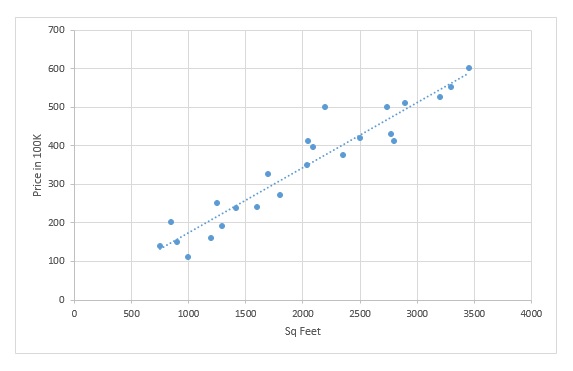
Secondly, we can observe that plots are following a linear trend, with increase in Sq Feet of area price is also increasing. We can generalize this trend by fitting a straight line like this –
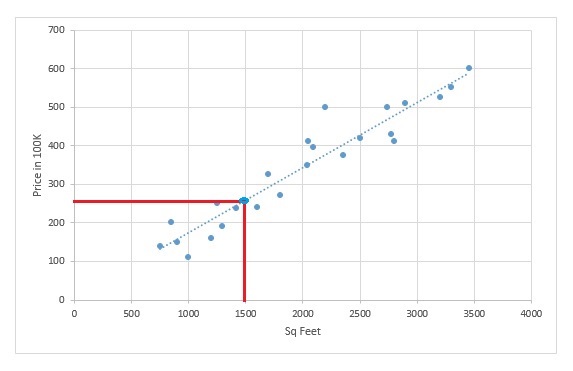
Now, if have a new house whose area is 1500 sq ft and we are asked to predict the price based on the trend, we just need to plot a point on graph for sq ft = 1500 and then we can get the corresponding price prediction on y axis. In this case the predicted price turns out to be 250,000K as per below.
This is the very basic intuitive idea and fundamental mathematics principle on which Regression is based on. During training phase, the machine learns to come up with the best line that will fit the training data. If you can recall your elementary mathematics you will realize his line is nothing but a linear function of form y=f(x) = wx + b . So we can say that machine learns to arrive at the best value of w and b during training phase.
This example shows a specific types of regression known as Linear Regression where data is distributed linearly and straight line is the generalized fit. Based on data distribution and type we have other variations of regression also like Polynomial Regression, Ridge Regression, Stepwise Regression to name the few.
Classification
Again, let us pick an example to understand classification more clearly. So let us consider we have past data of loan repayment given by bank to analyze. Work experience and salary of the applicant is being used to observe if the the loan was either repaid or defaulted.
Below scattered plot captures the data. The brown circle represents loan repayment failure and green circle represents successful repayment of loan.
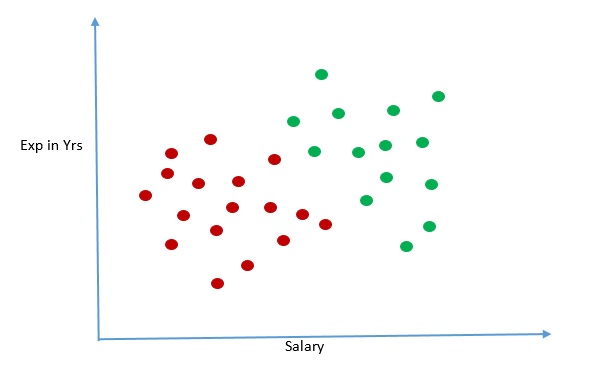
From the graph it is obvious that person with high salary along with higher work experience were able to repaid loan amount. With our human eyes we can clearly see a pattern here – the successful loan repayment and loan repayment failure cases are grouped together and there seems to be an invisible boundary that separates the two groups.
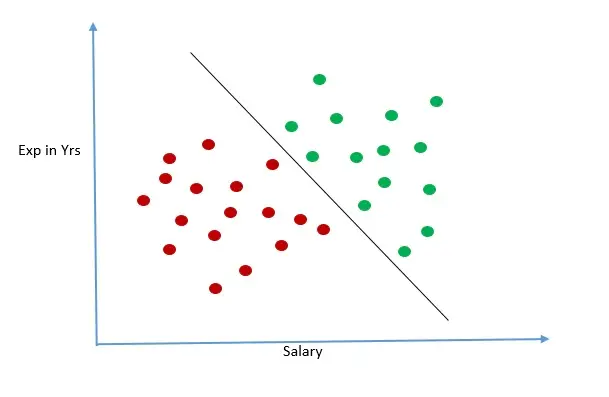
Let us take advantage of our human eyes and draw a straight line to separate the two groups.
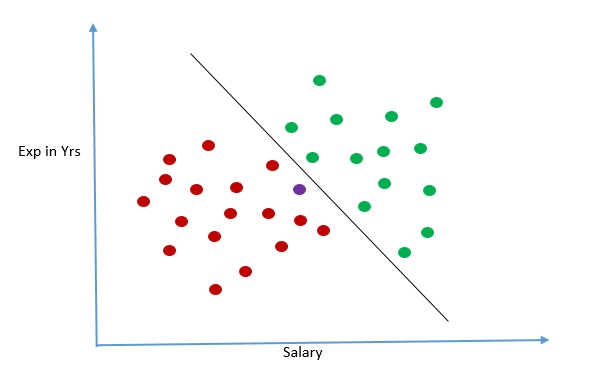
Now let us assume that there is a new loan application which we plot in the graph in purple. We can see below that the purple circle is lying on the side of the line where it is likely that applicant will fail to repay loan. With this prediction in hand we will advise bank not to approve the loan
This is the intuition behind classification problem in machine learning and how they are solved by machine. The line that we drew to separate data is also known as decision boundary. It was relatively easy for us to visualize this two dimensional data and draw boundary. But if number of independent attributes increase it would not be humanly possible to visualize so many dimension and draw a boundary.
A machine can however learn from high dimension data and come up with appropriate boundary for classifying data. Again, like regression we can see, machine tries to come up with a function that divides the two classes of outcome, and this line may not necessary be linear depending on the distribution of the data. There are however other classification methods which follows a very different approaches altogether.
This example shows binary classification where number of possible outcome is only two. We can also have more than two possible outcome in classification problem, which is also known as multi-class classification.
There are various machine learning techniques to do classification, the popular ones are K-Nearest Neighbor, Logistic Regression, Support Vector Machine, Decision Trees, Random Forest.
In the End…
We hope, the post gave you a good intuitive insight of two different types of supervised learning. For beginners, they tend to initially confuse when to use regression and when to use classification. Just remember this – if you are looking to predict a value or number in your problem use regression techniques else if you are looking to predict categories use classification techniques.

