Introduction
If you are a beginner, then you should be really aware of different types of probability distribution for machine learning or data science projects. This is important because certain ML models assume specific probability distribution of the underlying data to work efficiently so this knowledge will help you to choose the right model. Also, the knowledge of probability distribution will help you immensely to understand the characteristics of data during the exploratory data analysis (EDA) phase.
To help you out, in this article we will discuss different types of probability distribution you should know for machine learning or data science. We will also explain each of the probability distributions in Python code for better understanding.
Different Types of Probability Distribution (with Python Code)
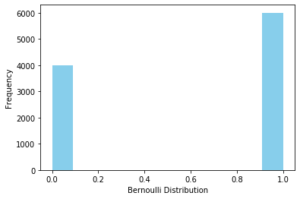
1. Bernoulli Distribution
A Bernoulli Distribution denotes the random probability of an event that only has two possible discrete outcomes like 0 and 1. The variable that follows Bernoulli probability distribution is known as the Bernoulli variable and the event is called the Bernoulli event.
If x is any Bernoulli variable and it can have only two discrete values whose probability lies between 0 to 1 then Probability Mass Function (PMF) of a Bernoulli distribution can be denoted mathematically as below –
![]()
Example of Bernoulli Distribution
The tossing of a coin is a Bernoulli event since it has only two possible discrete outcomes – Head (i.e. 1) and Tail (i.e. 0). Hence it follows the Bernoulli probability distribution.
Python Code for Bernoulli Distribution
Let us see how to visualize Bernoulli Distribution in Python code below –
from scipy.stats import bernoulli
import seaborn as sns
data_bern = bernoulli.rvs(size=10000,p=0.6)

ax= sns.distplot(data_bern,
                 kde=False,
                 color="skyblue",
                 hist_kws={"linewidth": 15,'alpha':1})
ax.set(xlabel='Bernoulli Distribution', ylabel='Frequency')
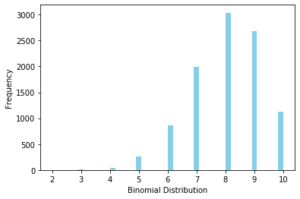
2. Binomial Distribution
The binomial distribution is the sum of independent Bernoulli events that have just two outcomes like 0 or 1 repeated multiple times.
The mathematical representation of binomial distribution is given by:
![]()
Example of Binomial Distribution
In the previous discussion, we saw that the tossing of a coin is a Bernoulli event. Now if we keep on repeating the tossing of the coin it will assume the Binomial probability distribution.
Python Code for Binomial Distribution
Let us see how to visualize Binomial Distribution in Python code below –
from scipy.stats import binom
data_binom = binom.rvs(n=10,p=0.8,size=10000)
ax = sns.distplot(data_binom,
                  kde=False,
                  color='skyblue',
                  hist_kws={"linewidth": 15,'alpha':1})
ax.set(xlabel='Binomial Distribution', ylabel='Frequency')
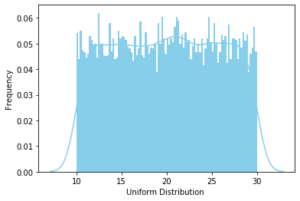
3. Uniform Distribution
An event follows a Uniform Probability Distribution when it’s all possible outcomes have an equal probability of occurrence. It is also known as rectangular distribution.
Mathematically, a variable X uniformly distributed if the density function is:
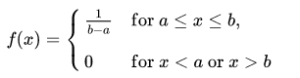
where a is the minimum value in the distribution and b is the maximum value.
Example of Uniform Distribution
A very intuitive example of uniform distribution is the rolling of a dice where each face has an equal probability of 1/6 of occurring.
Python Code for Uniform Distribution
Let us see how to visualize Uniform Distribution in Python code below –
from scipy.stats import uniform
n = 10000
start = 10
width = 20
data_uniform = uniform.rvs(size=n, loc = start, scale=width)

ax = sns.distplot(data_uniform,
                  bins=100,
                  kde=True,
                  color='skyblue',
                  hist_kws={"linewidth": 15,'alpha':1})
ax.set(xlabel='Uniform Distribution ', ylabel='Frequency')
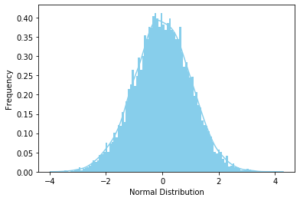
4. Normal Distribution
In a Normal Distribution, the probability of an outcome is more near the mean and the distribution follows a bell curve with lesser and lesser probability away from the mean. Most of the real-world scenarios can be represented with Normal Probability Distribution.
The normal distribution can be mathematically represented as, where µ is mean and σ is the standard deviation.
![]()
Example of Normal Distribution
According to numerous reports from the last few decades, the mean weight of an adult human is around 60 kgs. But there are people who are extremely overweight or very underweight but their occurrence becomes less on either side of the mean value. Hence the weight of people follows a normal probability distribution.
Python Code for Normal Distribution
Let us see how to visualize Normal Distribution in Python code below –
from scipy.stats import norm
# generate random numbers from N(0,1)
data_normal = norm.rvs(size=10000,loc=0,scale=1)

ax = sns.distplot(data_normal,
                          bins=100,
                          kde=True,
                          color='skyblue',
                          hist_kws={"linewidth": 15,'alpha':1})

ax.set(xlabel='Normal Distribution', ylabel='Frequency')
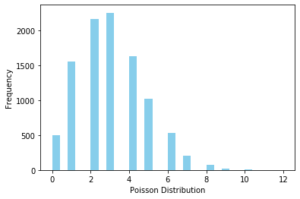
5. Poisson Distribution
The Poisson Distribution is used to determine the probability of a discrete event in a given period of time. These events have to be independent of each other and should occur at a constant rate in that period.
The probability mass function of X that follows a Poisson distribution is given by:
![]()
Example of Poisson Distribution
A particular restaurant may see a footfall of 8 customers every hour on average. The customer footfall is independent of each other since one customer will not influence another customer’s footfall. Also, the footfall can be as low as zero every hour to a very high number. This entire setup can be modeled using Poisson probability distribution to predict the customer footfall.
Python Code for Poisson Distribution
Let us see how to visualize Poisson Distribution in Python code below –
from scipy.stats import poisson
data_poisson = poisson.rvs(mu=3, size=10000)

ax = sns.distplot(data_poisson,
                  bins=30,
                  kde=False,
                  color='skyblue',
                  hist_kws={"linewidth": 15,'alpha':1})
ax.set(xlabel='Poisson Distribution', ylabel='Frequency')